Elastic Security dashboards
Elastic Cloud Serverless projects are autoscaled environments, fully managed by Elastic and available on Elastic Cloud. Availability This functionality is generally available and ready for production usage. The Elastic Stack includes Elastic's core products such as Elasticsearch, Kibana, Logstash, and Beats. Availability This functionality is generally available and ready for production usage. Unless stated otherwise on the page, this functionality is available when your Elastic Stack is deployed on Elastic Cloud Hosted, Elastic Cloud Enterprise, Elastic Cloud on Kubernetes, and self-managed environments. This documentation corresponds to the latest patch available for each minor version. If you're not using the latest patch, check the release notes for changes.
Serverless Security
Generally available
Stack
Generally available
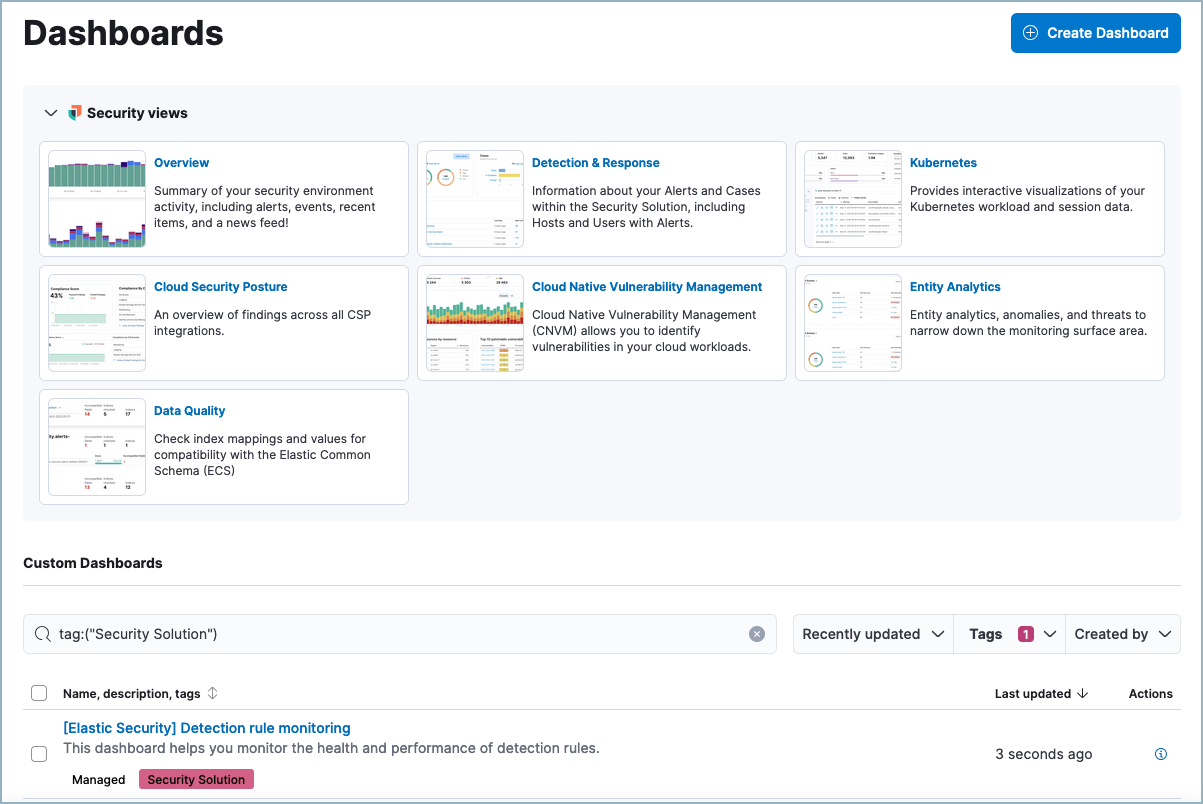
The Elastic Security app's default dashboards provide useful visualizations of your security environment. To view them in Elastic Security, select Dashboards from the navigation menu. From the Dashboards page, you can access the default dashboards, as well as create and access custom dashboards.
To create a new custom dashboard, click Create Dashboard. You can control which custom dashboards appear in the table:
- Use the text search field to filter by name or description.
- Use the Tags menu to filter by tag.
- Click a custom dashboard’s tags to toggle filtering for each tag.
To create a new tag or edit existing tags, open the Tags menu and click Manage tags.
Refer to documentation for the other Elastic Security dashboards to learn more about them. For more information about creating custom dashboards, refer to Create your first Kibana dashboard.