View field statistics in Discover
Elastic Cloud Serverless projects are autoscaled environments, fully managed by Elastic and available on Elastic Cloud. Availability This functionality is generally available and ready for production usage. Serverless interfaces and procedures might differ from classic Elastic Stack deployments. The Elastic Stack includes Elastic's core products such as Elasticsearch, Kibana, Logstash, and Beats. Availability This functionality is generally available and ready for production usage. Unless stated otherwise on the page, this functionality is available when your Elastic Stack is deployed on Elastic Cloud Hosted, Elastic Cloud Enterprise, Elastic Cloud on Kubernetes, and self-managed environments. This documentation corresponds to the latest patch available for each minor version. If you're not using the latest patch, check the release notes for changes.
Serverless
Generally available
Stack
Generally available
If you don't know yet what your data looks like, the Field statistics view in Discover shows each field's most common values, ranges, and how many documents contain it. That helps you spot data problems and decide what to chart before you build visualizations.
- Make sure Discover is in classic mode. ES|QL mode doesn't support this functionality. To switch, refer to Switch to Discover's classic mode.
- Discover must have a data view selected and a time range that contains data.
- The Field statistics view is on by default. If it's missing from Discover, check whether the Show field statistics advanced setting is turned on.
- This example uses the web logs sample data. To follow along, add it, or use your own data.
Go to Discover.
Expand the data view menu, and select Kibana Sample Data Logs.
If you don't see any results, expand the time range, for example, to Last 7 days.
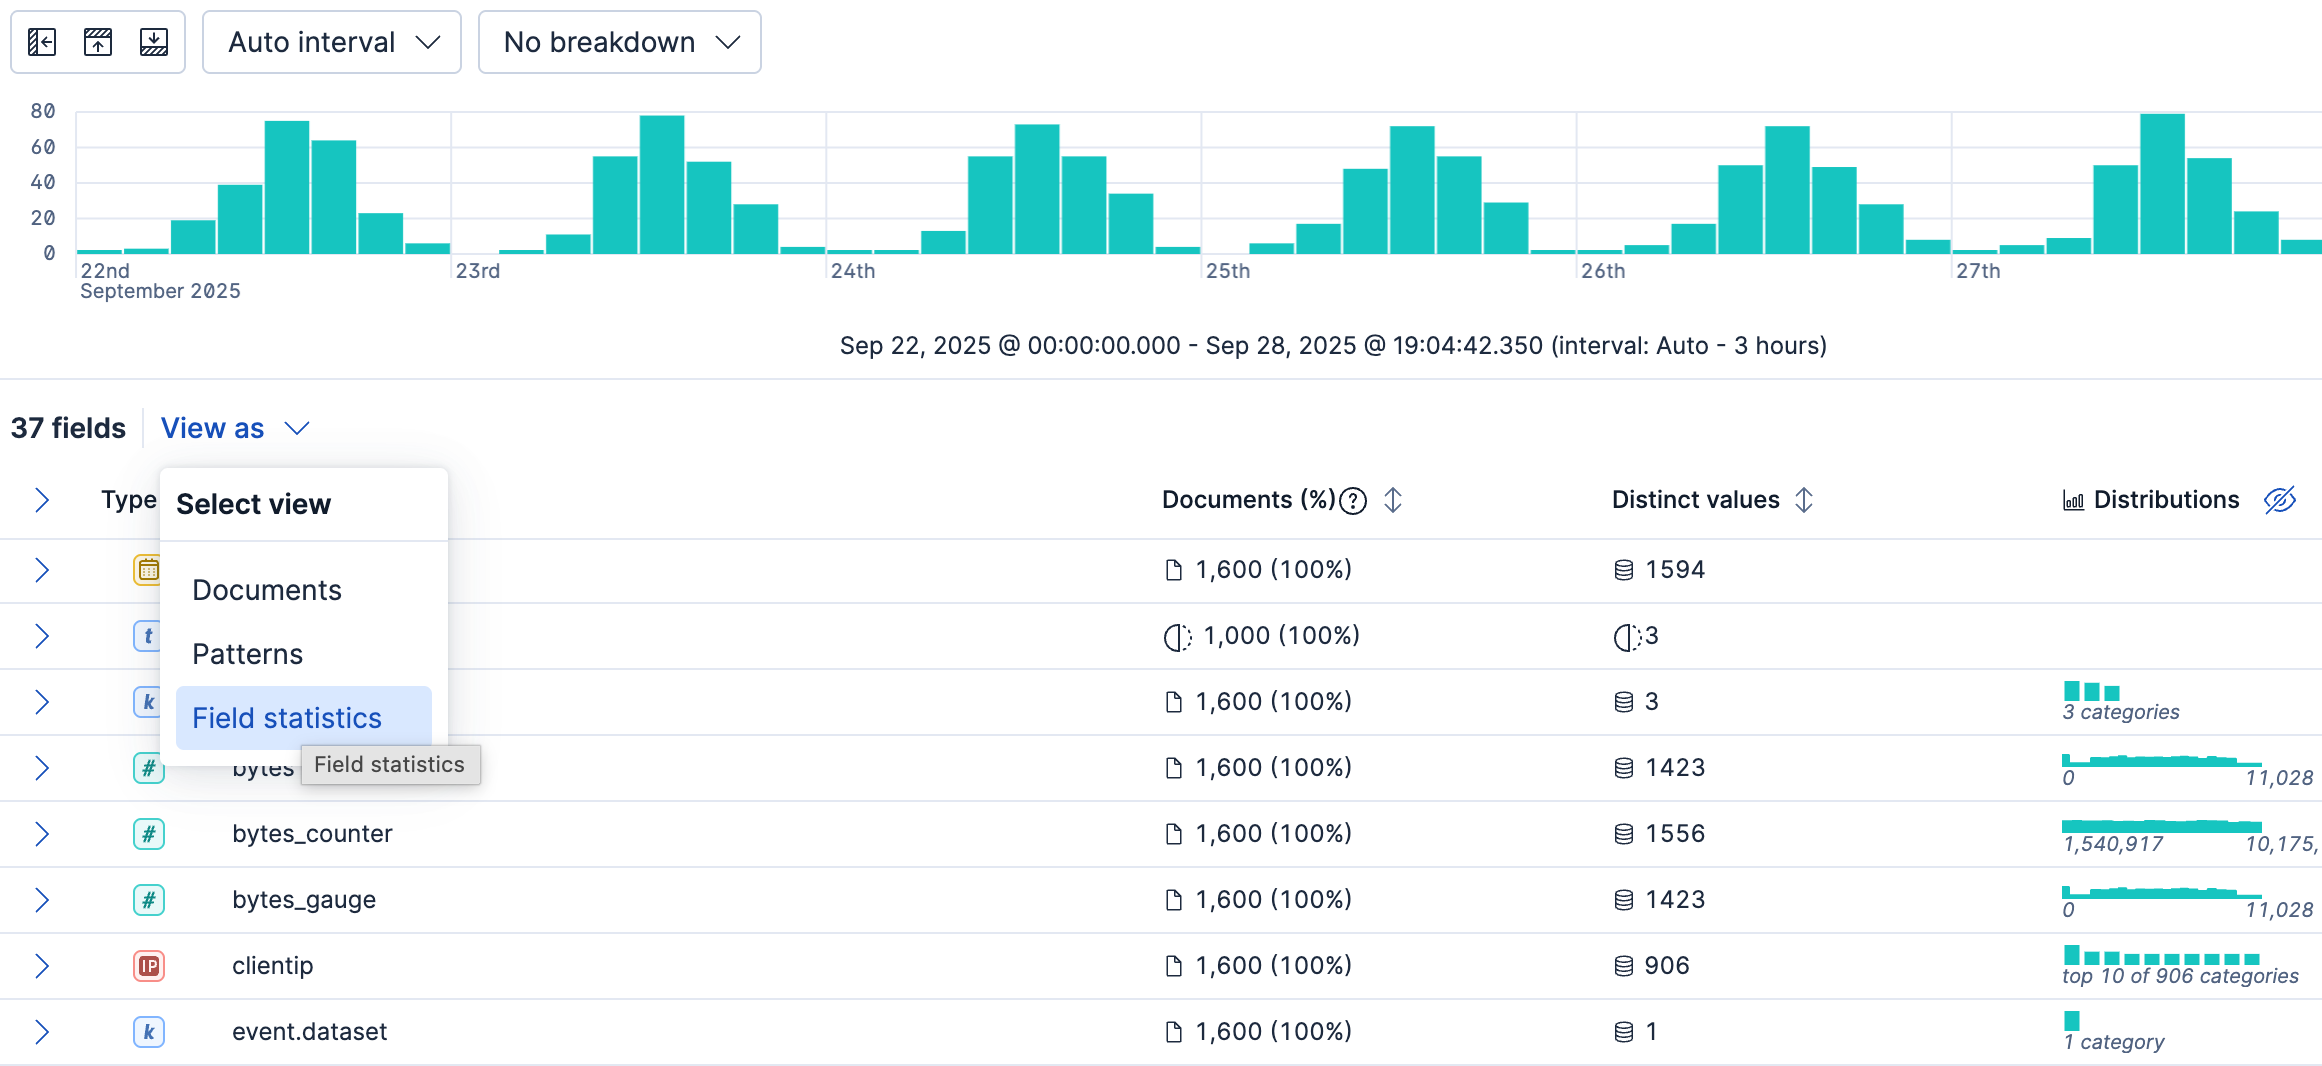
Select Field statistics (or View as → Field statistics, depending on your version). The table summarizes, for each field, how many documents in the sample contain it for the selected time period, the number of distinct values, and the distribution.
Expand the
machine.ramfield. For numeric fields, Discover provides the document statistics, minimum, median, and maximum values, a list of top values, and a distribution chart. Use this chart to get a better idea of how the values in the data are clustered.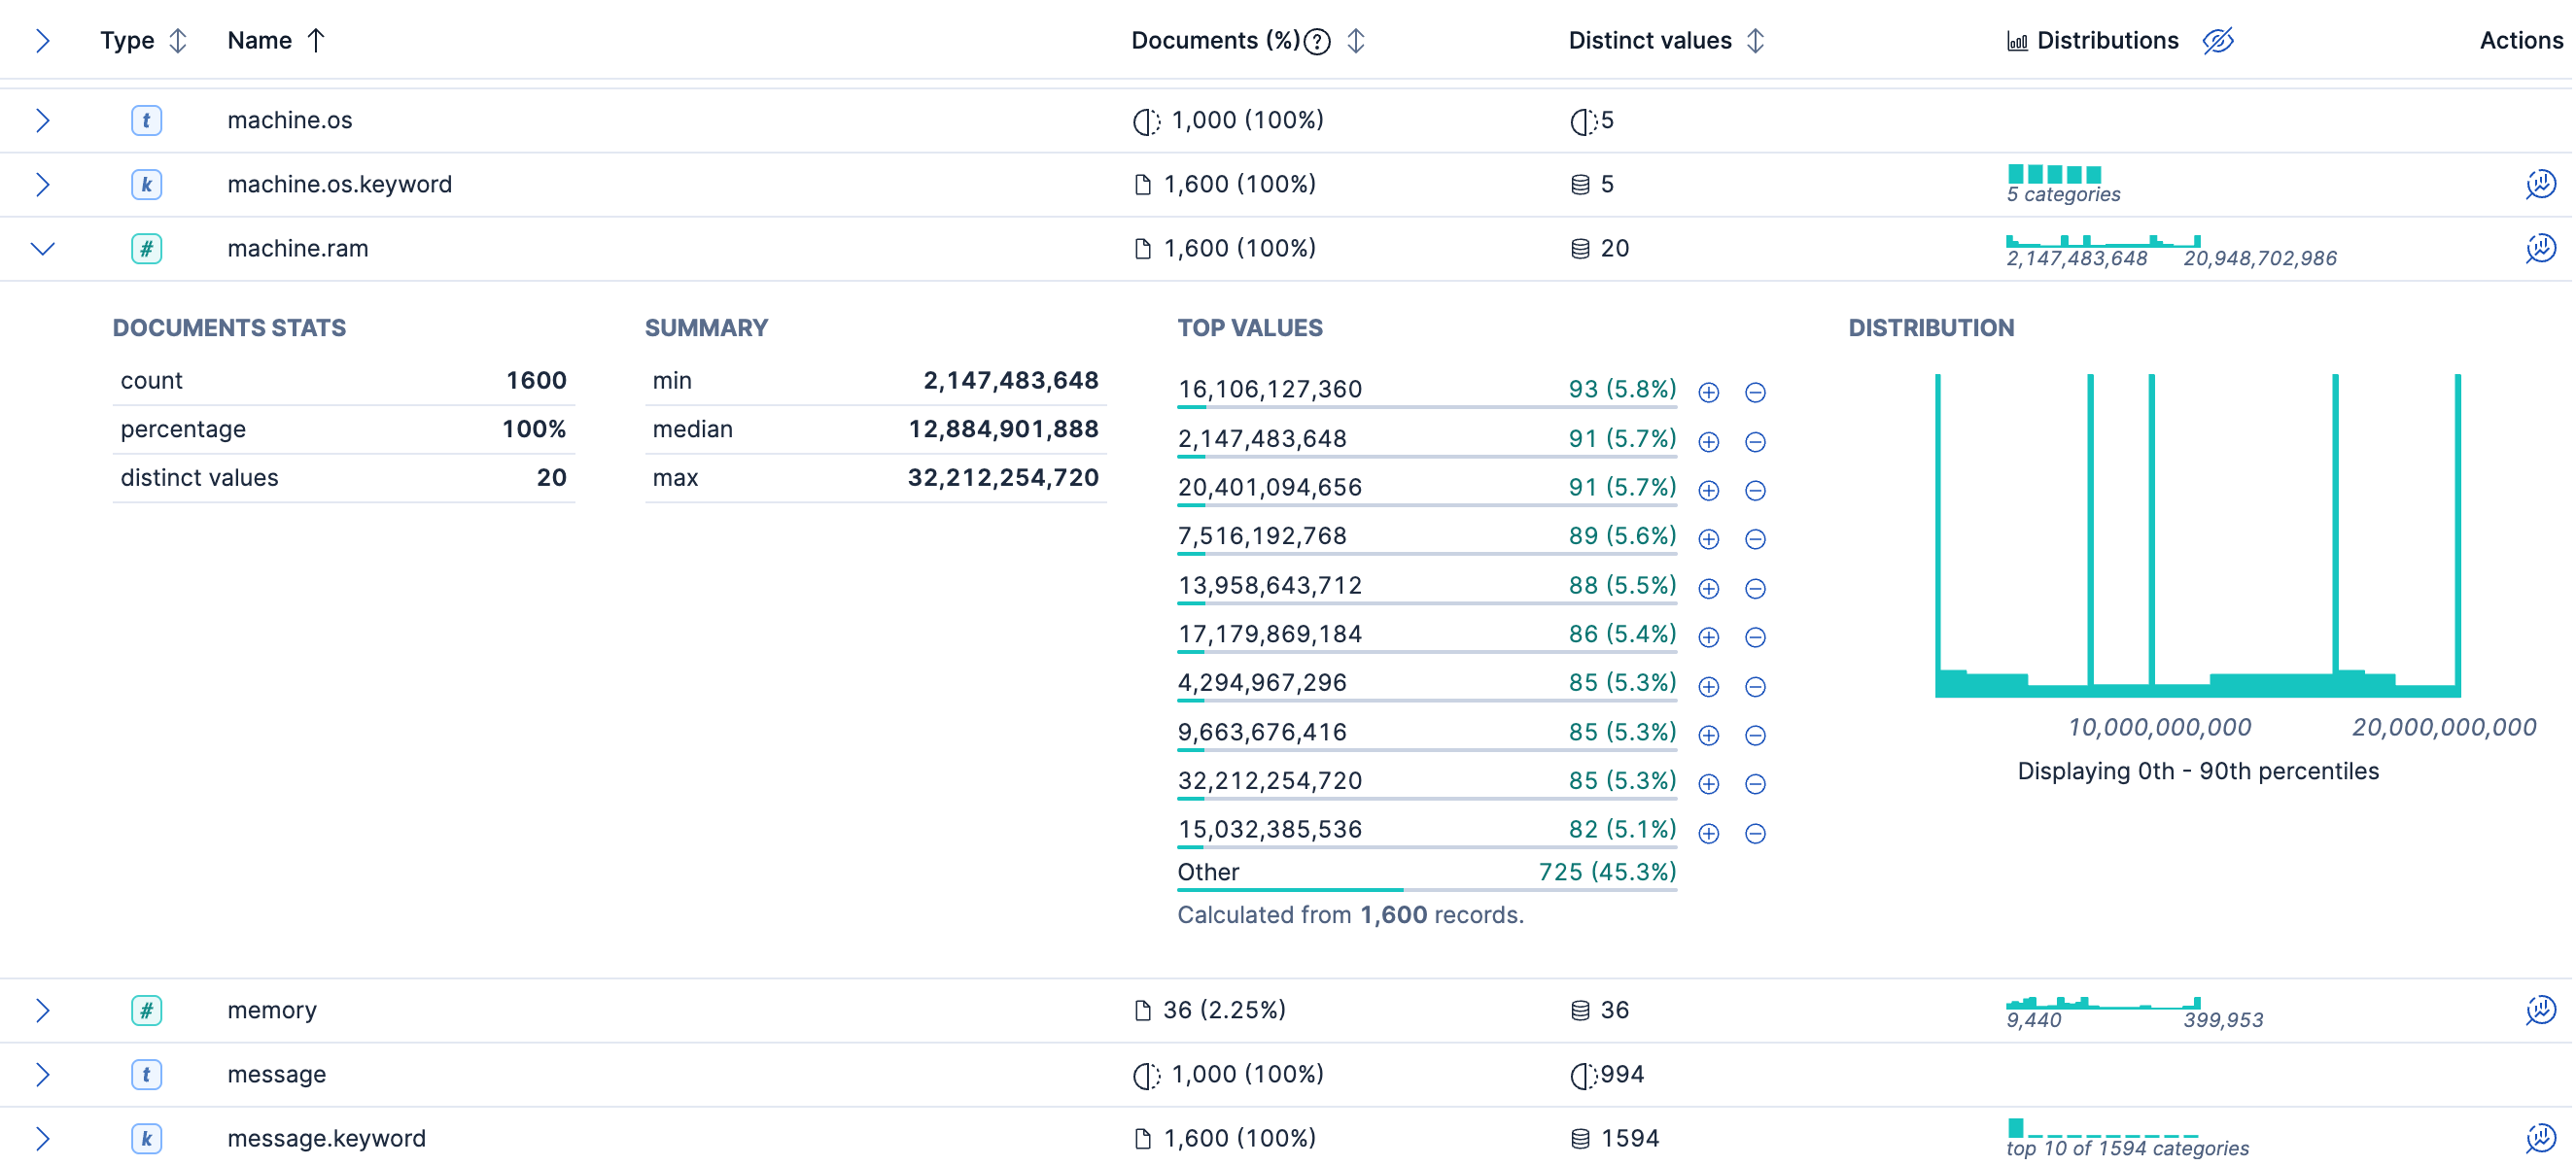
Expand the
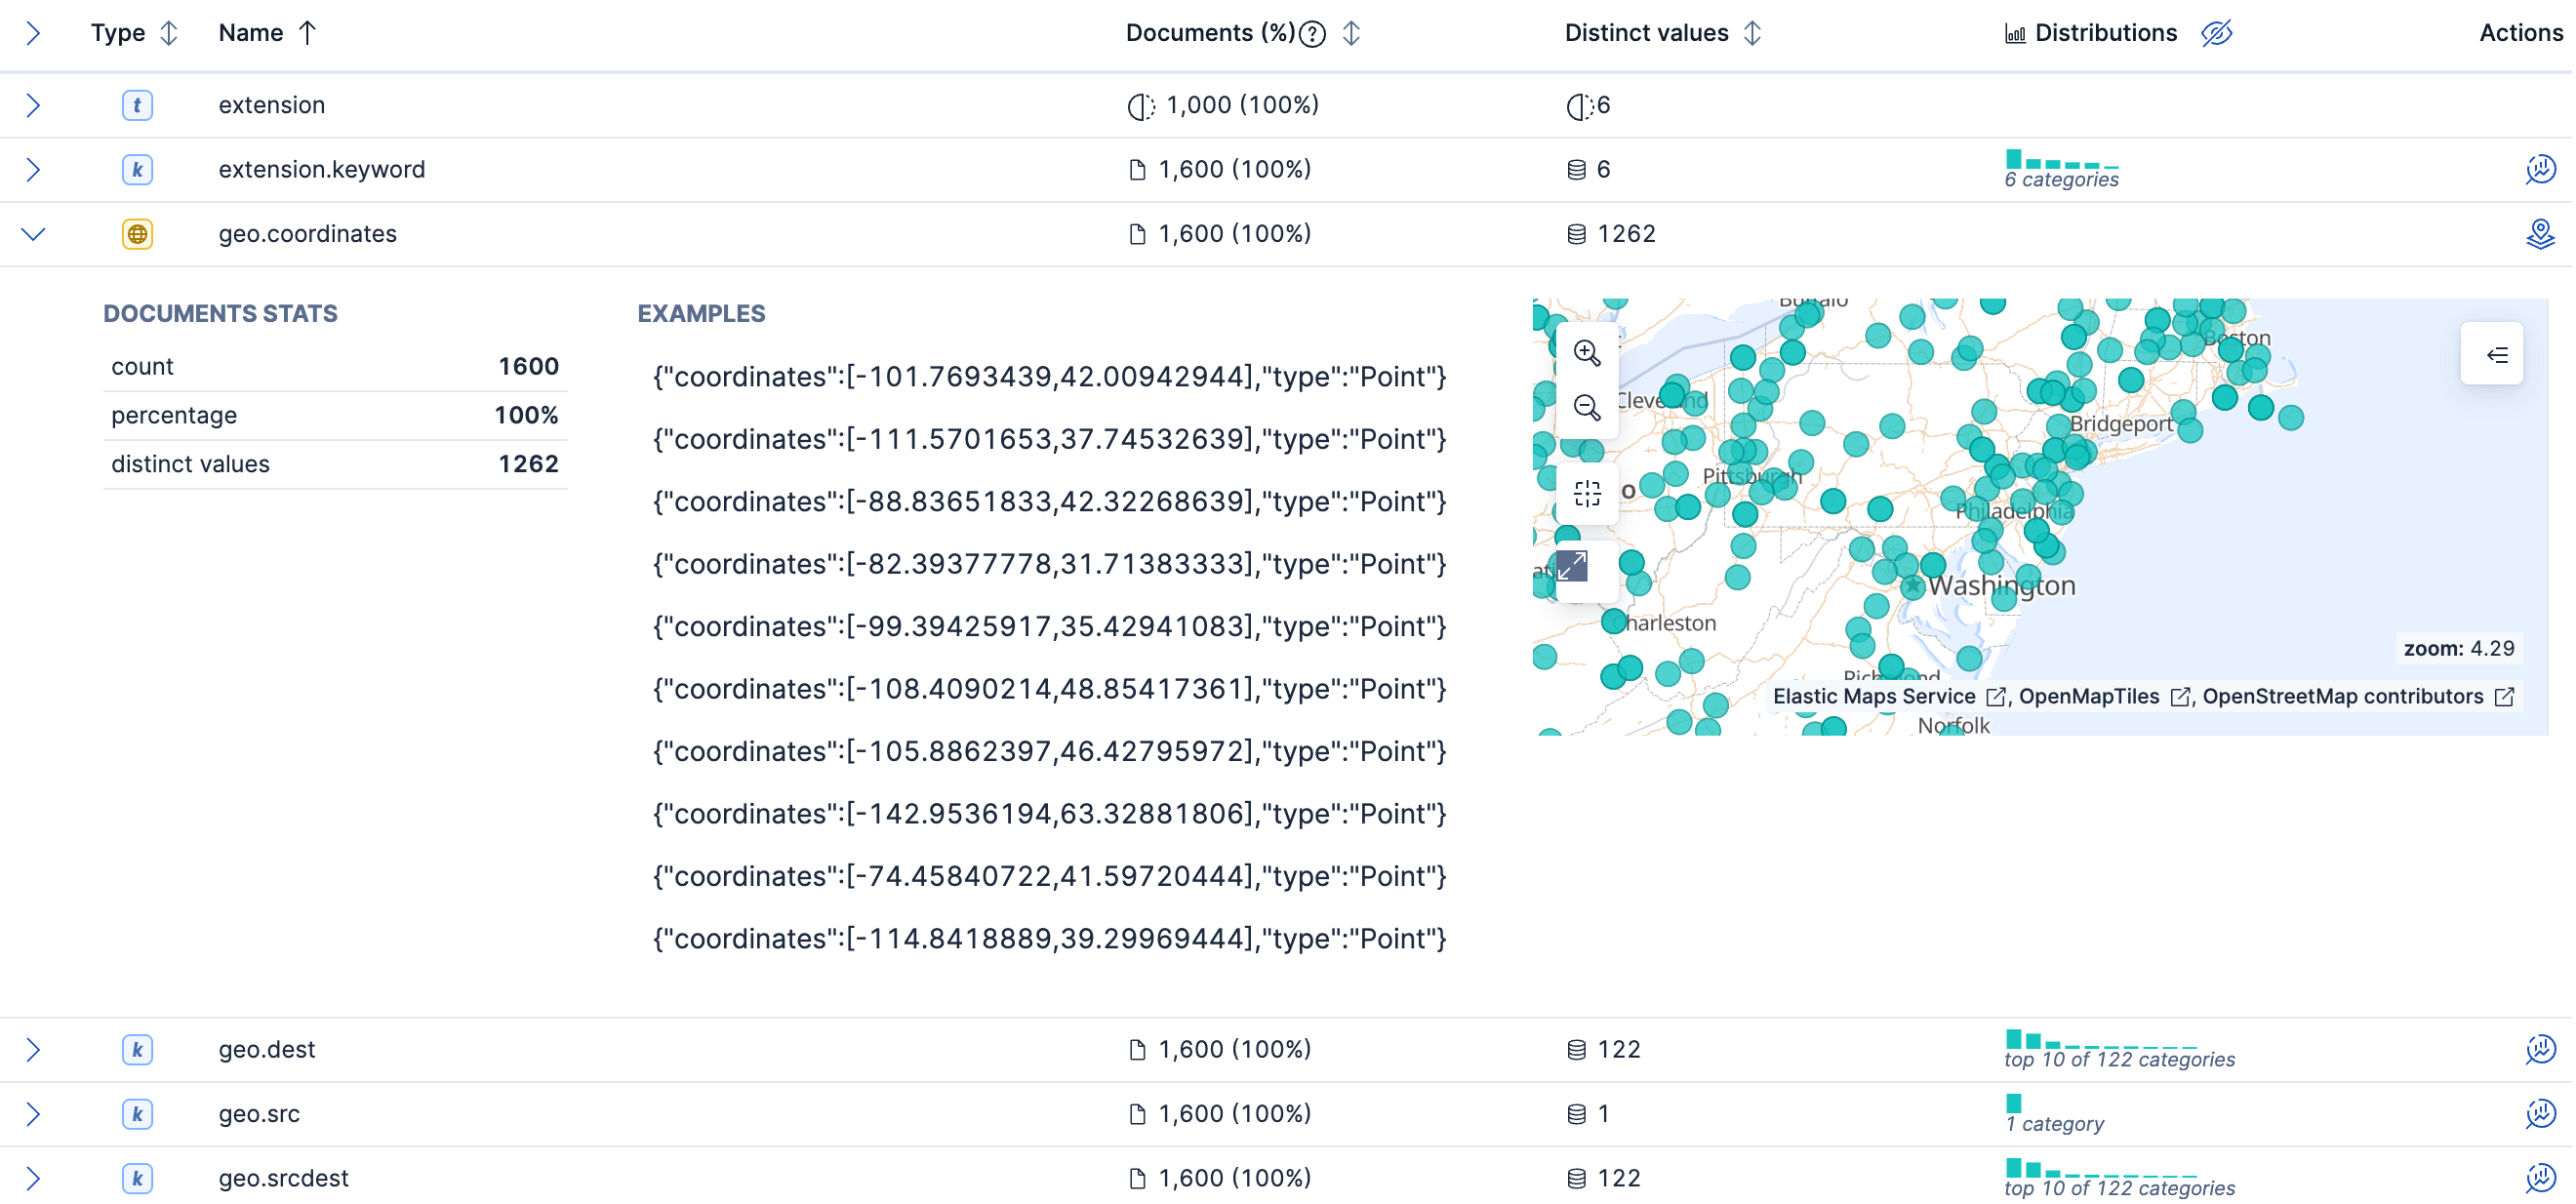
geo.coordinatesfield.For geo fields, Discover provides the document statistics, examples, and a map of the coordinates.
Optional: Expand fields of other types, such as keyword or date fields, to see the statistics that Discover provides for them.
Optional: To explore the field data in Lens or Maps, select Explore in Lens
 or Explore in Maps
 in the Actions column. These actions appear only if your role gives you access to visualizations and to maps, and Explore in Maps is available for geo fields only.
Result: Discover shows a row of statistics for each field in your data view, and you can expand a field to see its values in detail.
- To check a single field's top values from the fields list, refer to Explore fields in Discover.
- To chart a field, refer to Visualize a field from Discover.