Explore metrics data with Discover in Kibana
Elastic Cloud Serverless projects are autoscaled environments, fully managed by Elastic and available on Elastic Cloud. Availability This functionality is generally available and ready for production usage. Serverless interfaces and procedures might differ from classic Elastic Stack deployments. The Elastic Stack includes Elastic's core products such as Elasticsearch, Kibana, Logstash, and Beats. Availability This functionality is generally available and ready for production usage. This functionality is in technical preview and is ready for evaluation. Use with caution in production; it is not recommended for mission-critical workloads. Elastic will work to fix any issues, but features in technical preview are not subject to the support SLA of official GA features. Specific Support terms apply. Unless stated otherwise on the page, this functionality is available when your Elastic Stack is deployed on Elastic Cloud Hosted, Elastic Cloud Enterprise, Elastic Cloud on Kubernetes, and self-managed environments. This documentation corresponds to the latest patch available for each minor version. If you're not using the latest patch, check the release notes for changes.
Serverless
Generally available
Stack
GA
9.4+
…
Generally available since 9.4
Preview from 9.2 to 9.3
Discover offers a dedicated experience for exploring metrics data. When Discover recognizes metrics data, it enables specific features and default behaviors to optimize your data exploration. Metrics-specific exploration in Discover automatically generates a grid of charts showing available metrics from your data. Use this view to quickly search and filter metrics, break metrics down by dimensions, review the ES|QL query that generates the charts, and add metrics to dashboards with a single click.
If you're just getting started with Discover and want to learn its main principles, you should get familiar with the default experience.
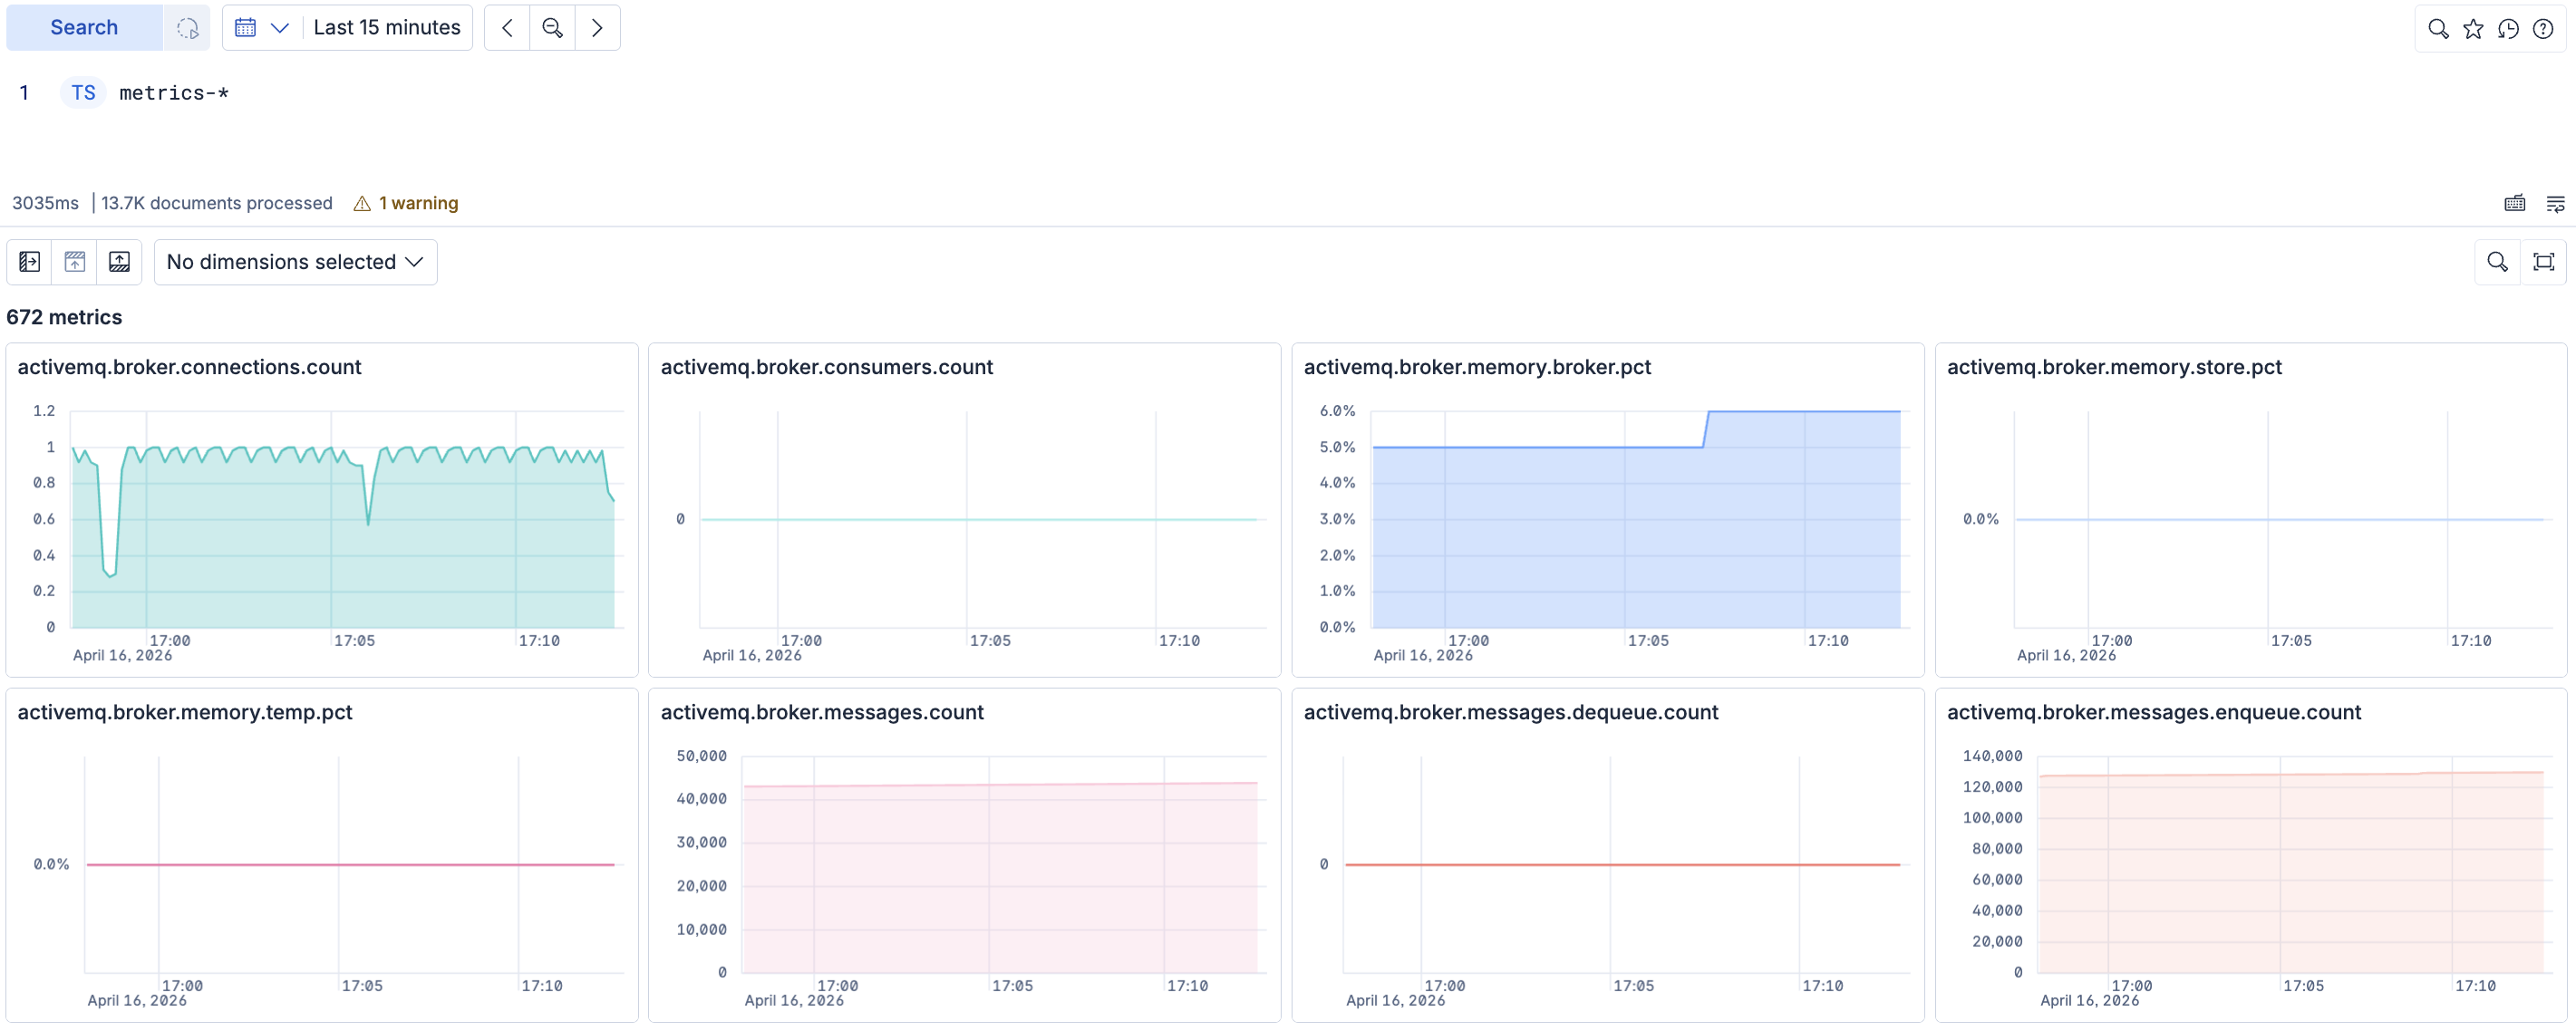
The dedicated metrics view is only available in ES|QL mode. If Discover doesn't open in ES|QL mode, select Query in ES|QL (Try ES|QL in earlier Elastic Stack versions) in the application menu.
Use the TS command to select the data source. For example, the following query returns all of your metrics data:
TS metrics-*
You can also query a specific index:
TS metrics-index-1
The query can also use the following commands. If it uses any other command, Discover shows the default experience instead of the dedicated metrics view.
LIMITSORT-
Elastic Cloud Serverless projects are autoscaled environments, fully managed by Elastic and available on Elastic Cloud.
Availability
Generally available
This functionality is generally available and ready for production usage.
Serverless interfaces and procedures might differ from classic Elastic Stack deployments.
The Elastic Stack includes Elastic's core products such as Elasticsearch, Kibana, Logstash, and Beats.
Availability
Generally available since 9.4
This functionality is generally available and ready for production usage.
Unless stated otherwise on the page, this functionality is available when your Elastic Stack is deployed on Elastic Cloud Hosted, Elastic Cloud Enterprise, Elastic Cloud on Kubernetes, and self-managed environments.
This documentation corresponds to the latest patch available for each minor version. If you're not using the latest patch, check the release notes for changes.
WHERE
To visualize your metrics data as charts:
The data stream needs its Index mode set to Time series. Open Index Management using the global search field, then select the Data Streams tab to find your data stream's index mode.
The metric must be a time series metric. Gauge, counter, and histogram metrics are supported.
The Elastic Stack includes Elastic's core products such as Elasticsearch, Kibana, Logstash, and Beats. Availability Generally available since 9.4 This functionality is generally available and ready for production usage. Unless stated otherwise on the page, this functionality is available when your Elastic Stack is deployed on Elastic Cloud Hosted, Elastic Cloud Enterprise, Elastic Cloud on Kubernetes, and self-managed environments. This documentation corresponds to the latest patch available for each minor version. If you're not using the latest patch, check the release notes for changes. Elastic Cloud Serverless projects are autoscaled environments, fully managed by Elastic and available on Elastic Cloud. Availability Generally available This functionality is generally available and ready for production usage. Serverless interfaces and procedures might differ from classic Elastic Stack deployments. Histogram metrics are charted using the 95th percentile by default. Supported field types are
tdigestandexponential_histogram.Metrics stored as the legacy
histogramfield type are also charted, but their percentiles are calculated assuming T-Digest encoding. If the histogram was encoded differently, the chart shows a warning that the values might be approximate.
By default, all data stored in a metrics-* index is recognized as metrics data and triggers the Discover experience described on this page.
Viewing metrics data in Discover requires at least read privileges for Discover.
For more on assigning Kibana privileges, refer to the Kibana privileges documentation.
When the metrics profile is active, the documents table is collapsed by default so the chart grid takes the full view. You can expand the table at any time to view individual documents.
All metrics in the grid have data. If a metric appears empty, it's likely a counter metric where the scrape interval is smaller than the bucket size. To view the data, either expand the time range or click Explore for that metric and reduce the number of buckets in the query.
With your data loaded, use the metrics grid to:
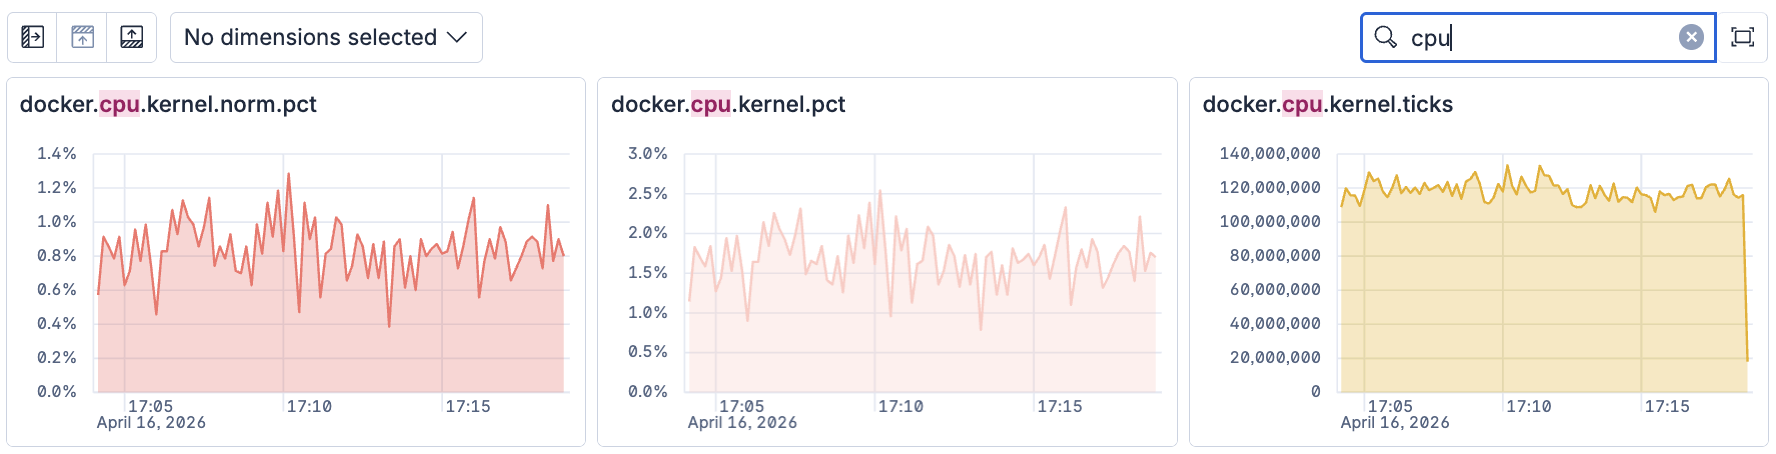
Search for specific metrics
Use the search function to find and visualize specific metric data:
- Sort the metrics grid The Elastic Stack includes Elastic's core products such as Elasticsearch, Kibana, Logstash, and Beats. Availability Planned We plan to add this functionality in a future Elastic Stack update. Subject to changes. Unless stated otherwise on the page, this functionality is available when your Elastic Stack is deployed on Elastic Cloud Hosted, Elastic Cloud Enterprise, Elastic Cloud on Kubernetes, and self-managed environments. This documentation corresponds to the latest patch available for each minor version. If you're not using the latest patch, check the release notes for changes. Elastic Cloud Serverless projects are autoscaled environments, fully managed by Elastic and available on Elastic Cloud. Availability Generally available This functionality is generally available and ready for production usage. Serverless interfaces and procedures might differ from classic Elastic Stack deployments.
-
Choose a sort order for the metrics grid:
- Alphabetically (default)
- Recently explored: Metrics you've interacted with, for example through View details or Copy to dashboard, appear first, the most recent first.
Break down metrics by dimensions
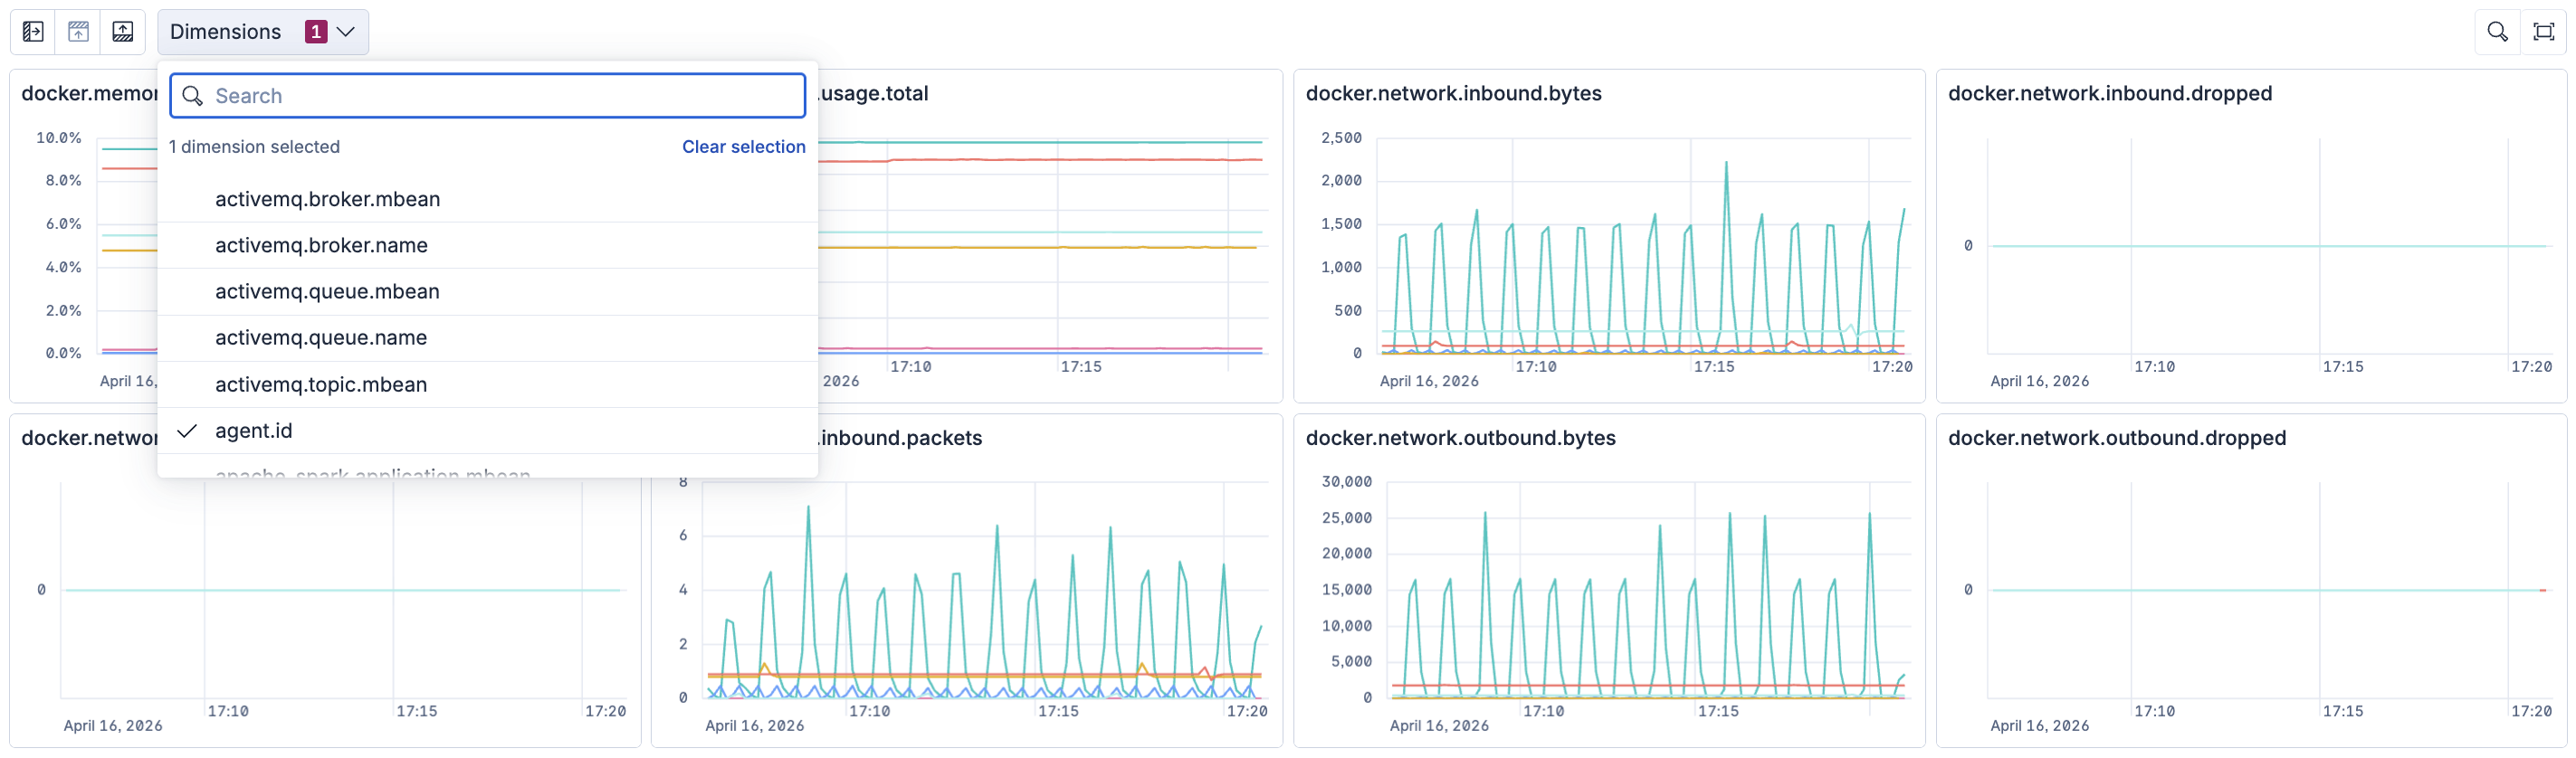
Break down your metrics by dimensions to find metrics that contain those dimensions and identify which values in those dimensions contribute the most to each metric.
The Elastic Stack includes Elastic's core products such as Elasticsearch, Kibana, Logstash, and Beats. Availability Generally available since 9.4 This functionality is generally available and ready for production usage. Unless stated otherwise on the page, this functionality is available when your Elastic Stack is deployed on Elastic Cloud Hosted, Elastic Cloud Enterprise, Elastic Cloud on Kubernetes, and self-managed environments. This documentation corresponds to the latest patch available for each minor version. If you're not using the latest patch, check the release notes for changes. Elastic Cloud Serverless projects are autoscaled environments, fully managed by Elastic and available on Elastic Cloud. Availability Generally available This functionality is generally available and ready for production usage. Serverless interfaces and procedures might differ from classic Elastic Stack deployments. You can break down by up to five dimensions at a time. Each chart shows a separate line for every combination of the selected dimension values.
The Dimensions control shows a badge with the number of selected dimensions. Select Clear selection to deselect them all. If you select five dimensions, you must deselect a dimension before you can add another.
Only fields mapped as dimensions in a time series data stream are available for metric breakdown. If an expected dimension is missing, verify that the field is mapped as a time_series_dimension in your
time series data stream (TSDS) configuration.
You can filter the view to focus on specific values in two ways:
- Click a chart value: After you break down by one or more dimensions, hover over a chart and click the value you want to filter by. This adds the corresponding dimension-value pairs to your query and updates the metrics view to show only metrics with those dimension values.
- Edit the query directly: Manually add a
| WHEREclause to your ES|QL query. For example:| WHERE <dimension> = <value>
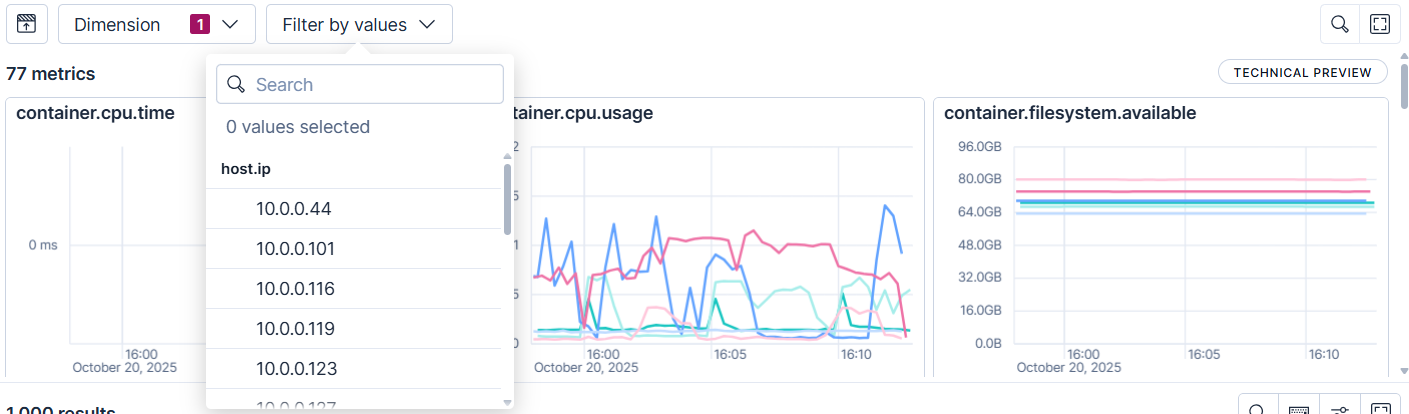
Filter dimensions by a specific value
Select specific values to focus on within the dimension. You can select up to 10 values to filter your dimension by.
- Change how metrics are aggregated The Elastic Stack includes Elastic's core products such as Elasticsearch, Kibana, Logstash, and Beats. Availability Planned We plan to add this functionality in a future Elastic Stack update. Subject to changes. Unless stated otherwise on the page, this functionality is available when your Elastic Stack is deployed on Elastic Cloud Hosted, Elastic Cloud Enterprise, Elastic Cloud on Kubernetes, and self-managed environments. This documentation corresponds to the latest patch available for each minor version. If you're not using the latest patch, check the release notes for changes. Elastic Cloud Serverless projects are autoscaled environments, fully managed by Elastic and available on Elastic Cloud. Availability Generally available This functionality is generally available and ready for production usage. Serverless interfaces and procedures might differ from classic Elastic Stack deployments.
-
Select Edit grid of metrics ( ) in the toolbar to open the Configuration flyout, where you can change the default aggregation for each metric type. Select Apply and close to update every metric of that type in the current Discover tab.
- Counter: average, sum (default), minimum, and maximum
- Gauge: average (default), sum, minimum, and maximum
- Histogram: 50th percentile, 75th percentile, 90th percentile, 95th percentile (default), and 99th percentile
View metric charts in full screen
Select full screen ( ) to view the metric charts in full-screen mode.
For each metric chart, you can perform the following actions:
- Explore ( ): Open Discover filtered to focus on that specific metric.
- Inspect ( ): Show details about the query request and response.
- View details ( ): Get additional information about the metric like metric type, dimensions, and ES|QL query.
- Copy to dashboard ( ): Save the metric chart to an existing or new dashboard.
- Add to case ( ): Add the metric chart to a case.