Anomaly detection jobs from visualizations
Elastic Cloud Serverless projects are autoscaled environments, fully managed by Elastic and available on Elastic Cloud. Availability This functionality is generally available and ready for production usage. Serverless interfaces and procedures might differ from classic Elastic Stack deployments. The Elastic Stack includes Elastic's core products such as Elasticsearch, Kibana, Logstash, and Beats. Availability This functionality is generally available and ready for production usage. Unless stated otherwise on the page, this functionality is available when your Elastic Stack is deployed on Elastic Cloud Hosted, Elastic Cloud Enterprise, Elastic Cloud on Kubernetes, and self-managed environments. This documentation corresponds to the latest patch available for each minor version. If you're not using the latest patch, check the release notes for changes.
Serverless
Generally available
Stack
Generally available
You can create anomaly detection jobs from the compatible Lens charts on Dashboard.
- Only chart-like visualizations are compatible. Supported chart types are
area,area_percentage_stacked,area_stacked,bar,bar_horizontal,bar_horizontal_stacked,bar_percentage_stacked,bar_stacked, andline. - Supported anomaly detection functions are
average,count,max,median,min,sum,unique_count. - The chart must contain a date field on one axis and it must be the same as the default date field for the data view.
- In case of a multi-layered chart, only the compatible layers can be used to create an anomaly detection job.
- Chart layers which contain a field that uses a time shift or a field that has a
filter bysetting applied cannot be used to create an anomaly detection job.
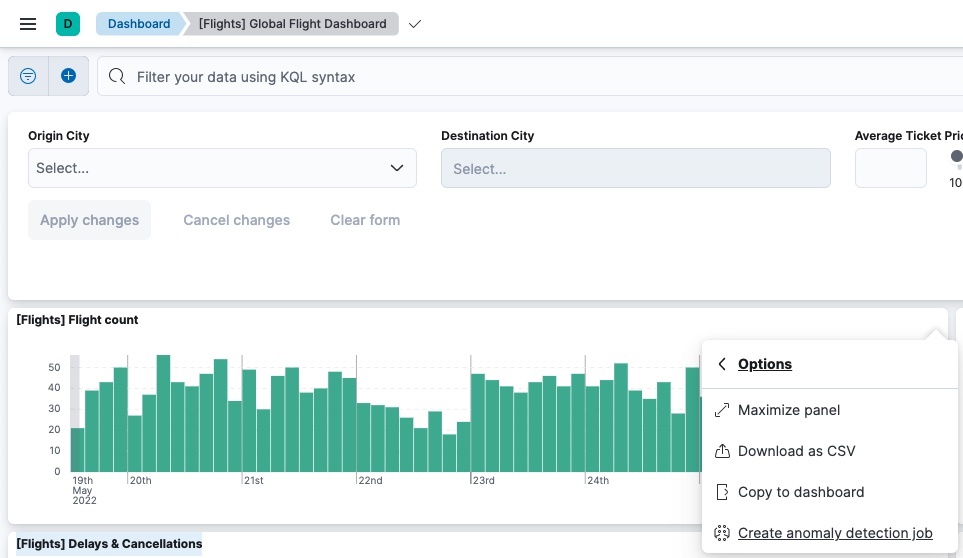
You need to have a compatible visualization on Dashboard to create an anomaly detection job. If you don’t have one but you want to try the feature out, go to Analytics > Dashboard and select the [Flight] Global Flight Dashboard which is based on the Kibana sample flight data set. Select the Flight count visualization from the dashboard.
- Go to Analytics > Dashboard from the main menu, or use the global search field. Select a dashboard with a compatible visualization.
- Open the Options (…) menu for the panel, then select More.
- Select Create anomaly detection job. The option is only displayed if the visualization can be converted to an anomaly detection job configuration.
- (Optional) Select the layer from which the anomaly detection job is created.
If the visualization has multiple compatible layers, you can select which layer to use for creating the anomaly detection job.
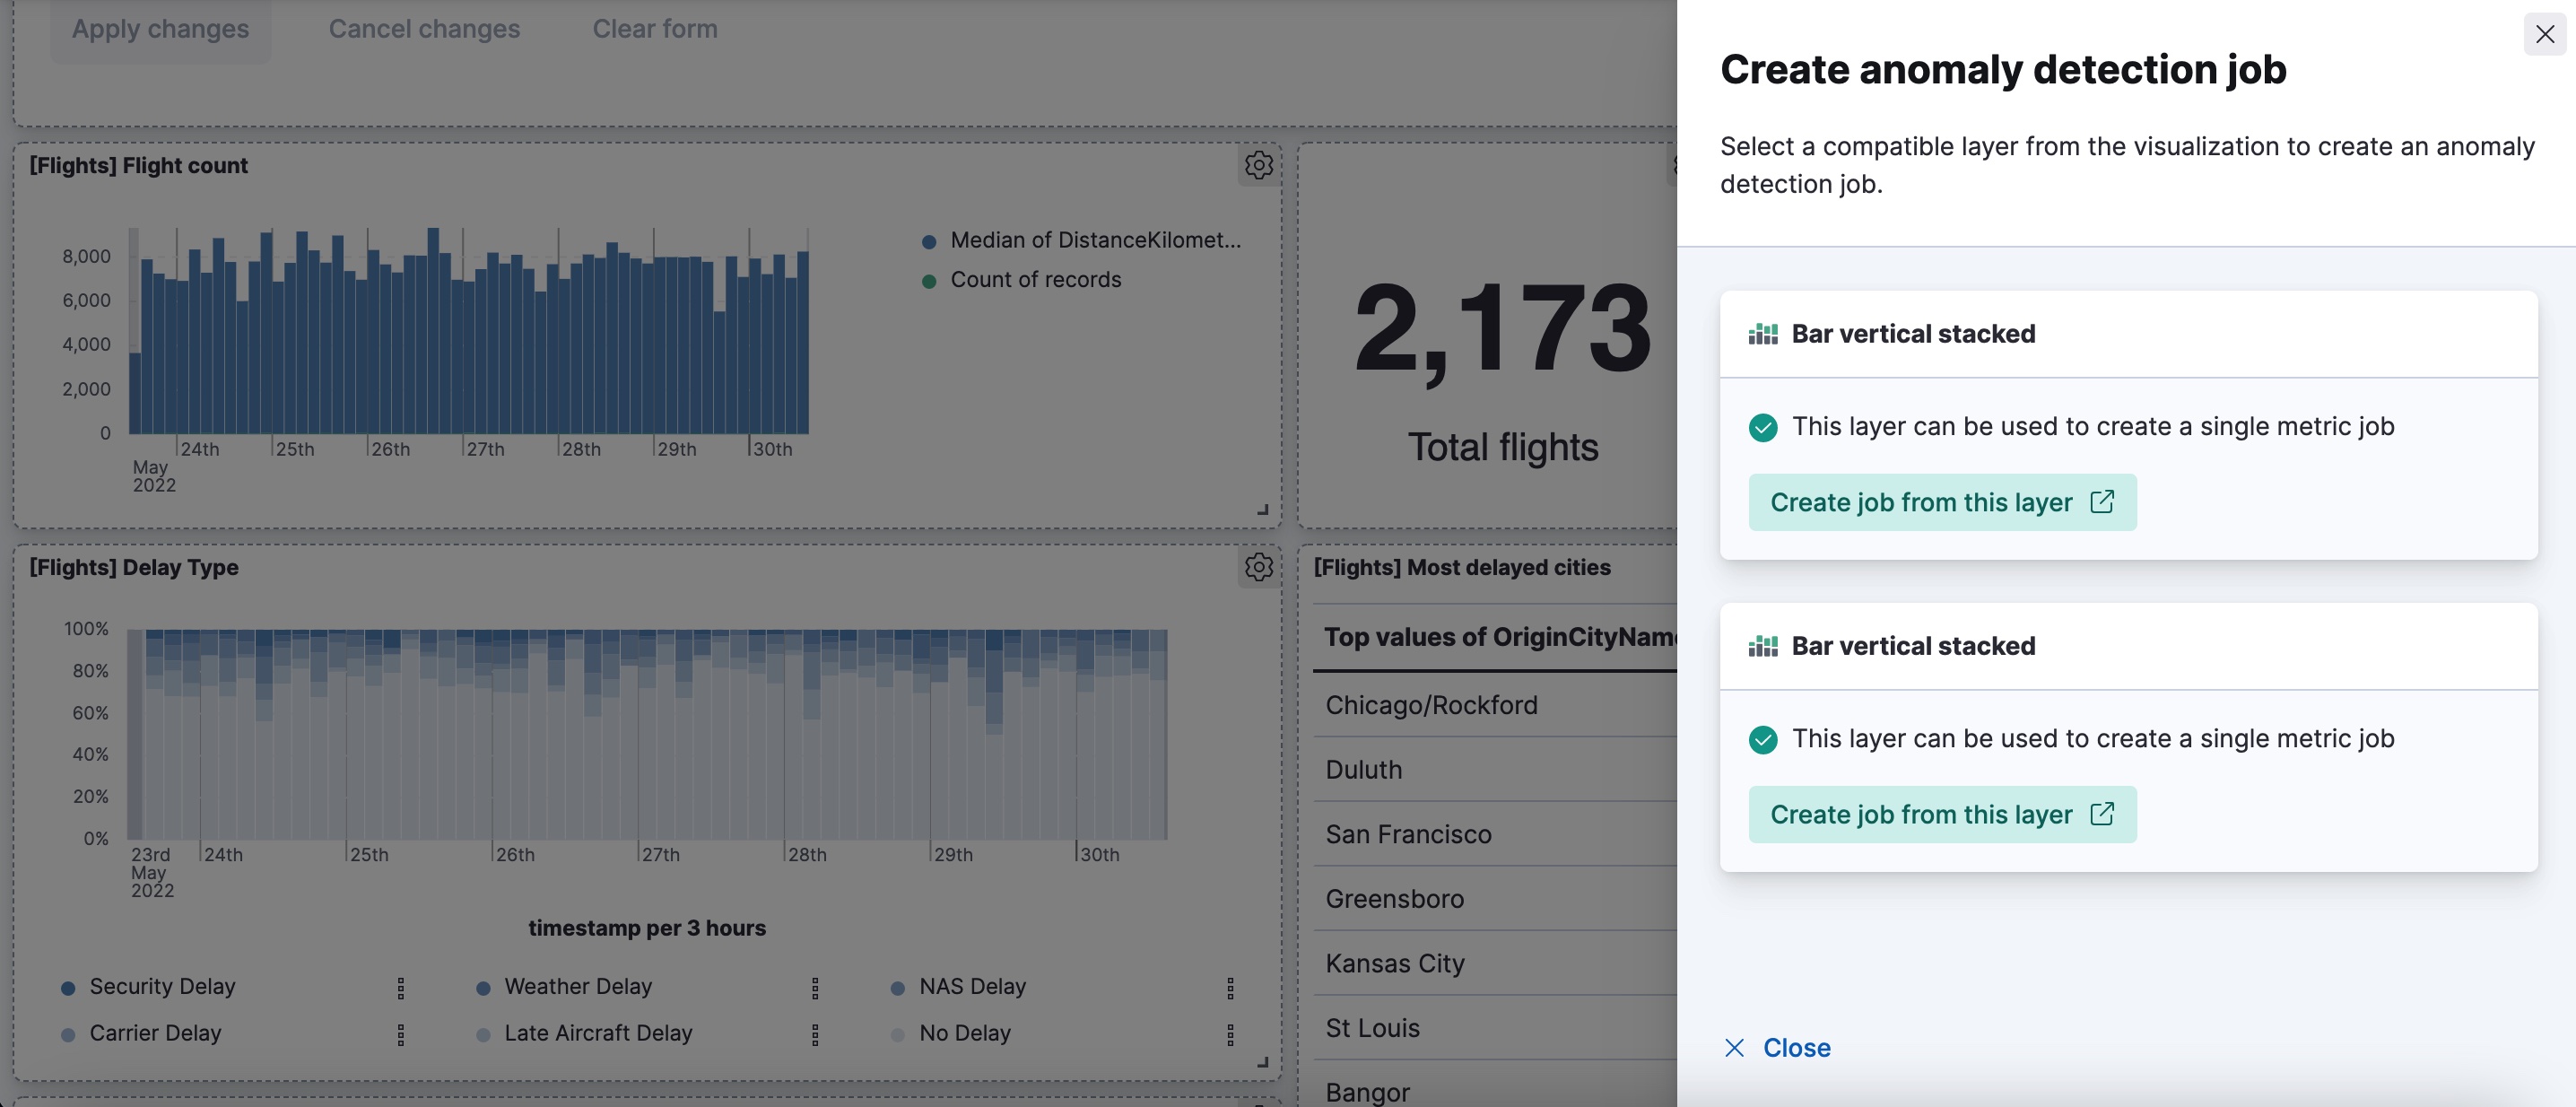
If multiple fields are added to the chart or you selected a Break down by field, the multi metric job wizard is used for creating the job. For a single metric chart, the single metric wizard is used.
If the configured time range of the chart is relative, it is converted to absolute start and end times in the job configuration. If the conversion of these times fails, the whole time range from the index is used.