Create an SLO burn rate rule
Elastic Cloud Serverless projects are autoscaled environments, fully managed by Elastic and available on Elastic Cloud. Availability This functionality is generally available and ready for production usage. Serverless interfaces and procedures might differ from classic Elastic Stack deployments. The Elastic Stack includes Elastic's core products such as Elasticsearch, Kibana, Logstash, and Beats. Availability This functionality is generally available and ready for production usage. Unless stated otherwise on the page, this functionality is available when your Elastic Stack is deployed on Elastic Cloud Hosted, Elastic Cloud Enterprise, Elastic Cloud on Kubernetes, and self-managed environments. This documentation corresponds to the latest patch available for each minor version. If you're not using the latest patch, check the release notes for changes.
Serverless
Generally available
Stack
Generally available
Create an SLO burn rate rule to get alerts when the burn rate is too high over a defined threshold for two different lookback periods: a long period and a short period that is 1/12th of the long period. For example, if your long lookback period is one hour, your short lookback period is five minutes.
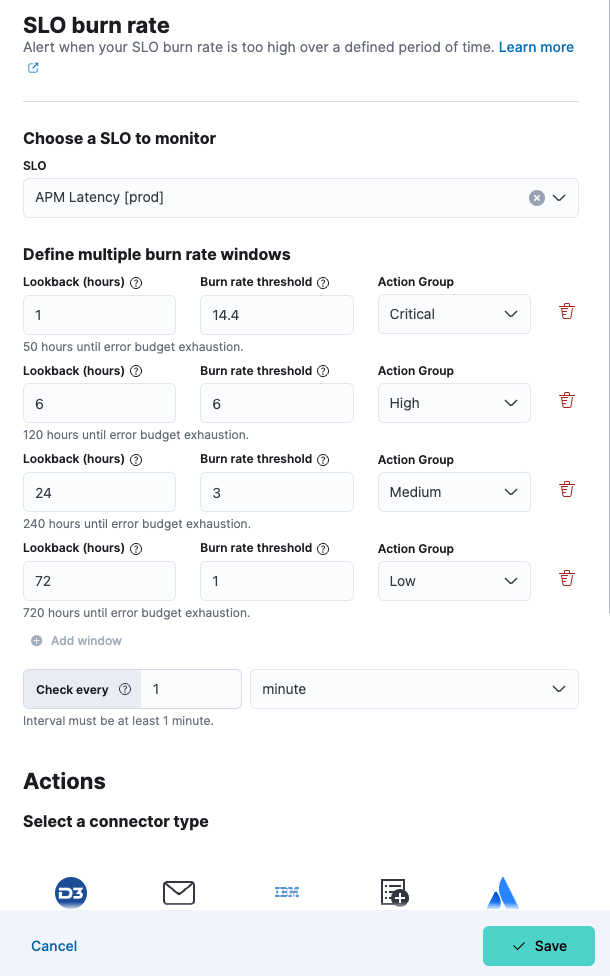
Choose which SLO to monitor and then define multiple burn rate windows with appropriate severity. For each period, the burn rate is computed as the error rate divided by the error budget. When the burn rates for both periods surpass the threshold, an alert is triggered. Add actions to raise alerts through services or third-party integrations for example, mail, Slack, Jira.
Rules use an API key to authorize all background tasks, including condition checks and triggered actions. The key type depends on your deployment. For details on how API keys authorize rules, refer to API keys.
To create SLO burn rate rules, you need the following:
-
The Elastic Stack includes Elastic's core products such as Elasticsearch, Kibana, Logstash, and Beats.
Availability
Generally available
This functionality is generally available and ready for production usage.
Unless stated otherwise on the page, this functionality is available when your Elastic Stack is deployed on Elastic Cloud Hosted, Elastic Cloud Enterprise, Elastic Cloud on Kubernetes, and self-managed environments.
This documentation corresponds to the latest patch available for each minor version. If you're not using the latest patch, check the release notes for changes.
An appropriate license, an Elasticsearch cluster with both
transformandingestnode roles present, and SLO access must be configured. - Elastic Cloud Serverless projects are autoscaled environments, fully managed by Elastic and available on Elastic Cloud. Availability Generally available This functionality is generally available and ready for production usage. Serverless interfaces and procedures might differ from classic Elastic Stack deployments. The Editor role or higher is required to create SLOs for Observability serverless projects. To learn more, refer to Assign user roles and privileges.
This rule queries the SLO Observability SLI and summary indices. The defaults are .slo-observability.sli* and .slo-observability.summary*. You cannot override these indices on a per-rule basis.
These steps show how to use the Alerts UI. You can also create an SLO burn rate rule directly from Observability → SLOs. Click the more options icon ( ) to the right of the SLO you want to add a burn rate rule for, and select Create new alert rule from the menu.
When you use the UI to create an SLO, a default SLO burn rate alert rule is created automatically. The burn rate rule will use the default configuration and no connector. You must configure a connector if you want to receive alerts for SLO breaches.
To create an SLO burn rate rule:
In Observability UI, go to Alerts.
Select Manage Rules from the Alerts page, and select Create rule.
Enter a Name for your rule, and any optional Tags for more granular reporting (leave blank if unsure).
Select SLO burn rate from the Select rule type list.
Select the SLO you want to monitor.
Define multiple burn rate windows for each Action Group (defaults to 4 windows but you can edit):
- Lookback (hours): Enter the lookback period for this window. A shorter period equal to 1/12th of this period will be used for faster recovery.
- Burn rate threshold: Enter a burn rate for this window.
- Action Group: Select a severity for this window.
Define the interval to check the rule for example check every 1 minute.
(Optional) Set up Actions.
Save your rule.
You can extend your rules with actions that interact with third-party systems, write to logs or indices, or send user notifications. You can add an action to a rule at any time. You can create rules without adding actions, and you can also define multiple actions for a single rule.
To add actions to rules, you must first create a connector for that service (for example, an email or external incident management system), which you can then use for different rules, each with their own action frequency.
Connector types
Connectors provide a central place to store connection information for services and integrations with third party systems. The following connectors are available when defining actions for alerting rules:
- Cases
- D3 Security
- IBM Resilient
- Index
- Jira
- Microsoft Teams
- Observability AI Assistant
- Opsgenie
- PagerDuty
- Server log
- ServiceNow ITOM
- ServiceNow ITSM
- ServiceNow SecOps
- Slack
- Swimlane
- Torq
- Webhook
- xMatters
Some connector types are paid commercial features, while others are free. For a comparison of the Elastic subscription levels, go to the subscription page.
For more information on creating connectors, refer to Connectors.
Action frequency
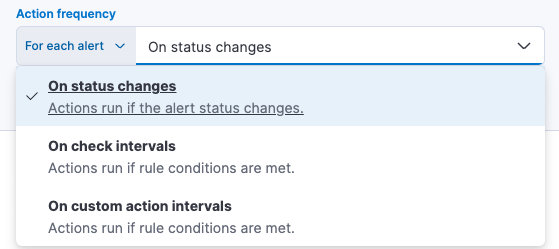
After you select a connector, you must set the action frequency. You can choose to create a Summary of alerts on each check interval or on a custom interval. For example, you can send email notifications that summarize the new, ongoing, and recovered alerts every twelve hours.
Alternatively, you can set the action frequency to For each alert and specify the conditions each alert must meet for the action to run. For example, you can send an email only when the alert status changes to critical.
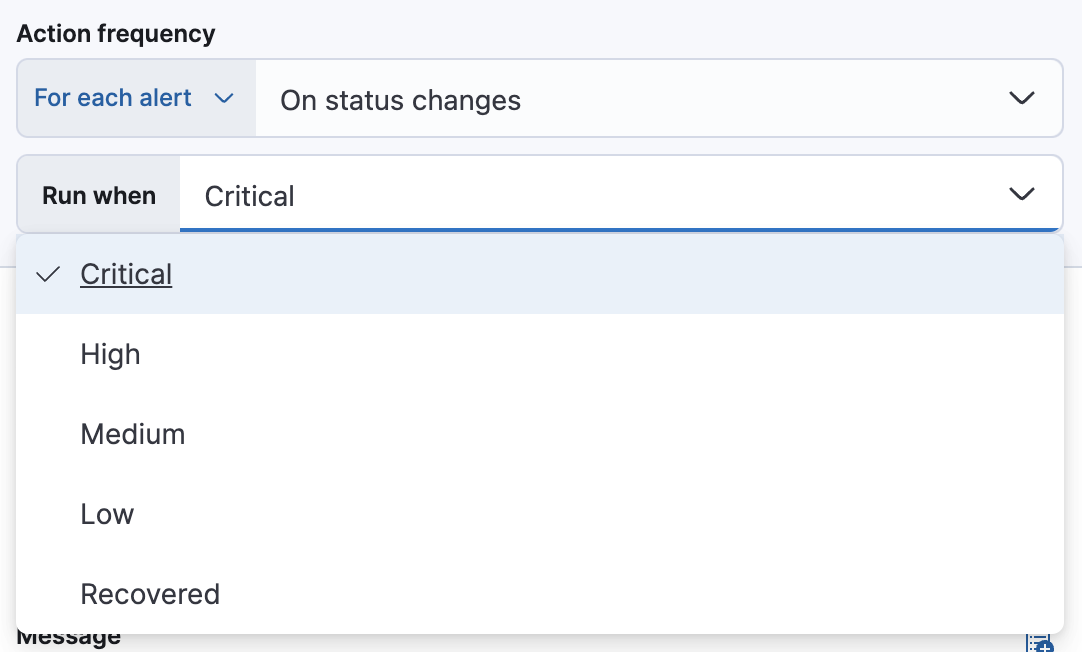
With the Run when menu you can choose if an action runs for a specific severity (critical, high, medium, low), or when the alert is recovered. For example, you can add a corresponding action for each severity you want an alert for, and also for when the alert recovers.
Action variables
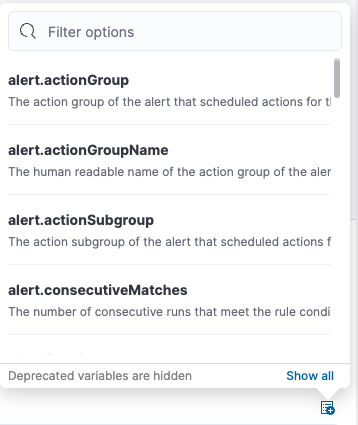
Use the default notification message or customize it. You can add more context to the message by clicking the Add variable icon  and selecting from a list of available variables.
The following variables are specific to this rule type. You can also specify variables common to all rules.
context.alertDetailsUrl- Link to the alert troubleshooting view for further context and details. This will be an empty string if the
server.publicBaseUrlis not configured. context.burnRateThreshold- The burn rate threshold value.
context.groupingThe Elastic Stack includes Elastic's core products such as Elasticsearch, Kibana, Logstash, and Beats. Availability Generally available since 9.1 This functionality is generally available and ready for production usage. Unless stated otherwise on the page, this functionality is available when your Elastic Stack is deployed on Elastic Cloud Hosted, Elastic Cloud Enterprise, Elastic Cloud on Kubernetes, and self-managed environments. This documentation corresponds to the latest patch available for each minor version. If you're not using the latest patch, check the release notes for changes.- The object containing groups that are reporting data.
context.longWindow- The window duration with the associated burn rate value.
context.reason- A concise description of the reason for the alert.
context.shortWindow- The window duration with the associated burn rate value.
context.sloId- The SLO unique identifier.
context.sloInstanceId- The SLO instance ID.
context.sloName- The SLO name.
context.timestamp- A timestamp of when the alert was detected.
context.viewInAppUrl-
The url to the SLO details page to help with further investigation.
Learn how to view alerts and triage SLO burn rate breaches: