Example: Parse logs
Elastic Cloud Serverless projects are autoscaled environments, fully managed by Elastic and available on Elastic Cloud. Availability This functionality is generally available and ready for production usage. Serverless interfaces and procedures might differ from classic Elastic Stack deployments. The Elastic Stack includes Elastic's core products such as Elasticsearch, Kibana, Logstash, and Beats. Availability This functionality is generally available and ready for production usage. Unless stated otherwise on the page, this functionality is available when your Elastic Stack is deployed on Elastic Cloud Hosted, Elastic Cloud Enterprise, Elastic Cloud on Kubernetes, and self-managed environments. This documentation corresponds to the latest patch available for each minor version. If you're not using the latest patch, check the release notes for changes.
Serverless
Generally available
Stack
Generally available
In this example tutorial, you’ll use an ingest pipeline to parse server logs in the Common Log Format before indexing. Before starting, check the prerequisites for ingest pipelines.
The logs you want to parse look similar to this:
212.87.37.154 - - [05/May/2099:16:21:15 +0000] "GET /favicon.ico HTTP/1.1" 200 3638 "-" "Mozilla/5.0 (Macintosh; Intel Mac OS X 10_11_6) AppleWebKit/537.36 (KHTML, like Gecko) Chrome/52.0.2743.116 Safari/537.36"
These logs contain a timestamp, IP address, and user agent. You want to give these three items their own field in Elasticsearch for faster searches and visualizations. You also want to know where the request is coming from.
In Kibana, go to the Ingest Pipelines management page using the navigation menu or the global search field.

Click Create pipeline > New pipeline.
Set Name to
my-pipelineand optionally add a description for the pipeline.Add a grok processor to parse the log message:
Click Add a processor and select the Grok processor type.
Set Field to
messageand Patterns to the following grok pattern:Text %{IPORHOST:source.ip} %{USER:user.id} %{USER:user.name} \[%{HTTPDATE:@timestamp}\] "%{WORD:http.request.method} %{DATA:url.original} HTTP/%{NUMBER:http.version}" %{NUMBER:http.response.status_code:int} (?:-|%{NUMBER:http.response.body.bytes:int}) %{QS:http.request.referrer} %{QS:user_agent}Click Add to save the processor.
Set the processor description to
Extract fields from 'message'.
Add processors for the timestamp, IP address, and user agent fields. Configure the processors as follows:
Processor type Field Additional options Description Date @timestampFormats: dd/MMM/yyyy:HH:mm:ss ZFormat '@timestamp' as 'dd/MMM/yyyy:HH:mm:ss Z'GeoIP source.ipTarget field: source.geoAdd 'source.geo' GeoIP data for 'source.ip'User agent user_agentExtract fields from 'user_agent'Your form should look similar to this:
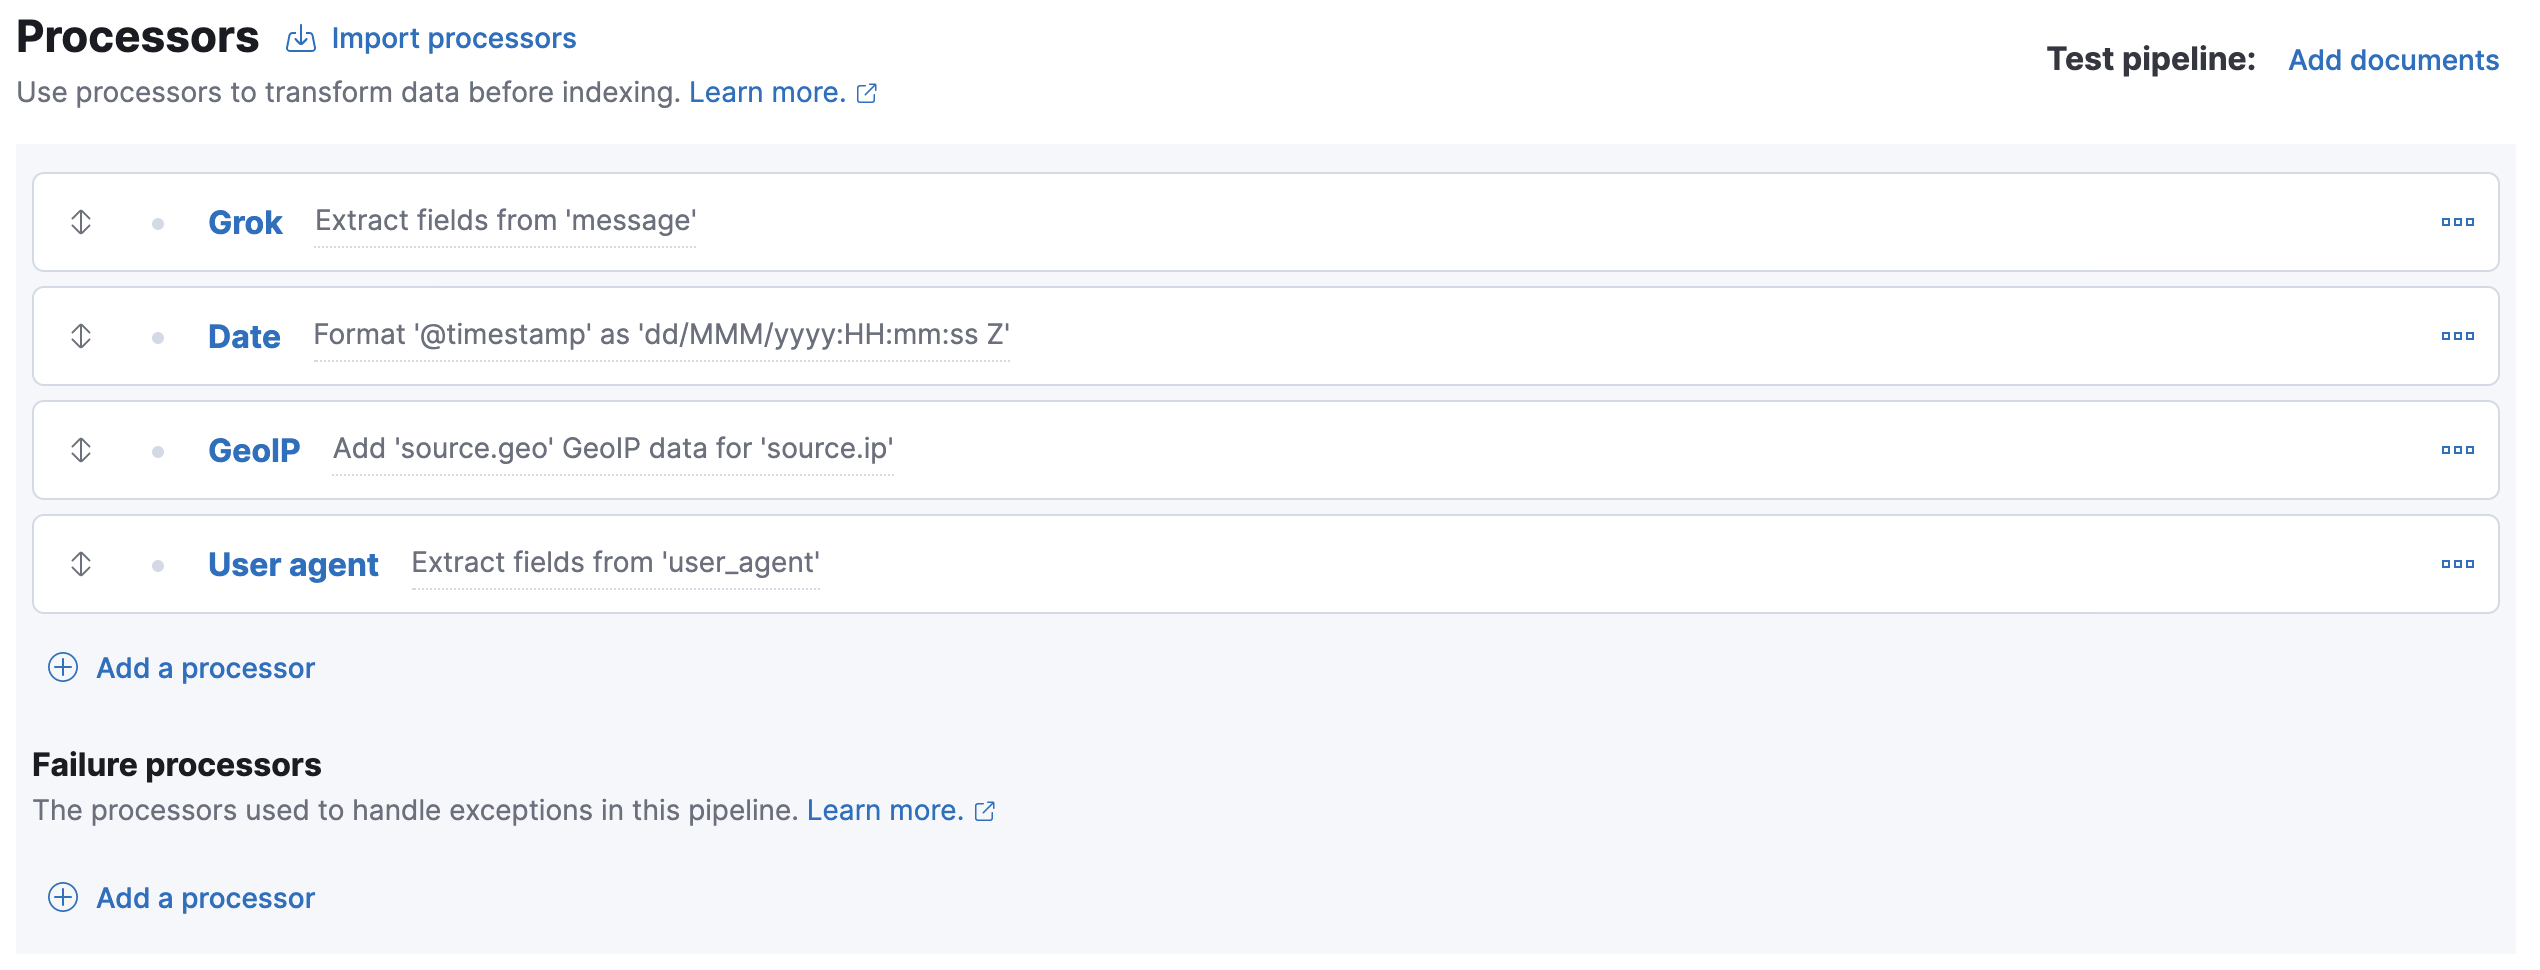
The four processors will run sequentially:
Grok > Date > GeoIP > User agent
You can reorder processors using the arrow icons.Alternatively, you can click the Import processors link and define the processors as JSON:
JavaScript { "processors": [ { "grok": { "description": "Extract fields from 'message'", "field": "message", "patterns": ["%{IPORHOST:source.ip} %{USER:user.id} %{USER:user.name} \\[%{HTTPDATE:@timestamp}\\] \"%{WORD:http.request.method} %{DATA:url.original} HTTP/%{NUMBER:http.version}\" %{NUMBER:http.response.status_code:int} (?:-|%{NUMBER:http.response.body.bytes:int}) %{QS:http.request.referrer} %{QS:user_agent}"] } }, { "date": { "description": "Format '@timestamp' as 'dd/MMM/yyyy:HH:mm:ss Z'", "field": "@timestamp", "formats": [ "dd/MMM/yyyy:HH:mm:ss Z" ] } }, { "geoip": { "description": "Add 'source.geo' GeoIP data for 'source.ip'", "field": "source.ip", "target_field": "source.geo" } }, { "user_agent": { "description": "Extract fields from 'user_agent'", "field": "user_agent" } } ] }To test the pipeline, click Add documents.
In the Documents tab, provide a sample document for testing:
JavaScript [ { "_source": { "message": "212.87.37.154 - - [05/May/2099:16:21:15 +0000] \"GET /favicon.ico HTTP/1.1\" 200 3638 \"-\" \"Mozilla/5.0 (Macintosh; Intel Mac OS X 10_11_6) AppleWebKit/537.36 (KHTML, like Gecko) Chrome/52.0.2743.116 Safari/537.36\"" } } ]Click Run the pipeline and verify the pipeline worked as expected.
If everything looks correct, close the panel, and then click Create pipeline.
You’re now ready to index the logs data to a data stream.
Create an index template with data stream enabled.
JSON PUT _index_template/my-data-stream-template{ "index_patterns": [ "my-data-stream*" ], "data_stream": { }, "priority": 500 }Index a document with the pipeline you created.
JSON POST my-data-stream/_doc?pipeline=my-pipeline{ "message": "89.160.20.128 - - [05/May/2099:16:21:15 +0000] \"GET /favicon.ico HTTP/1.1\" 200 3638 \"-\" \"Mozilla/5.0 (Macintosh; Intel Mac OS X 10_11_6) AppleWebKit/537.36 (KHTML, like Gecko) Chrome/52.0.2743.116 Safari/537.36\"" }To verify, search the data stream to retrieve the document. The following search uses
filter_pathto return only the document source.JSON GET my-data-stream/_search?filter_path=hits.hits._sourceThe API returns:
JSON { "hits": { "hits": [ { "_source": { "@timestamp": "2099-05-05T16:21:15.000Z", "http": { "request": { "referrer": "\"-\"", "method": "GET" }, "response": { "status_code": 200, "body": { "bytes": 3638 } }, "version": "1.1" }, "source": { "ip": "89.160.20.128", "geo": { "continent_name" : "Europe", "country_name" : "Sweden", "country_iso_code" : "SE", "city_name" : "Linköping", "region_iso_code" : "SE-E", "region_name" : "Östergötland County", "location" : { "lon" : 15.6167, "lat" : 58.4167 } } }, "message": "89.160.20.128 - - [05/May/2099:16:21:15 +0000] \"GET /favicon.ico HTTP/1.1\" 200 3638 \"-\" \"Mozilla/5.0 (Macintosh; Intel Mac OS X 10_11_6) AppleWebKit/537.36 (KHTML, like Gecko) Chrome/52.0.2743.116 Safari/537.36\"", "url": { "original": "/favicon.ico" }, "user": { "name": "-", "id": "-" }, "user_agent": { "original": "\"Mozilla/5.0 (Macintosh; Intel Mac OS X 10_11_6) AppleWebKit/537.36 (KHTML, like Gecko) Chrome/52.0.2743.116 Safari/537.36\"", "os": { "name": "Mac OS X", "version": "10.11.6", "full": "Mac OS X 10.11.6" }, "name": "Chrome", "device": { "name": "Mac" }, "version": "52.0.2743.116" } } } ] } }