Plot big data
Elastic Cloud Serverless projects are autoscaled environments, fully managed by Elastic and available on Elastic Cloud. Availability This functionality is generally available and ready for production usage. Serverless interfaces and procedures might differ from classic Elastic Stack deployments. The Elastic Stack includes Elastic's core products such as Elasticsearch, Kibana, Logstash, and Beats. Availability This functionality is generally available and ready for production usage. Unless stated otherwise on the page, this functionality is available when your Elastic Stack is deployed on Elastic Cloud Hosted, Elastic Cloud Enterprise, Elastic Cloud on Kubernetes, and self-managed environments. This documentation corresponds to the latest patch available for each minor version. If you're not using the latest patch, check the release notes for changes.
Serverless
Generally available
Stack
Generally available
Use aggregations to plot large data sets without overwhelming your network or your browser. When using aggregations, the documents stay in Elasticsearch and only the calculated values for each group are returned to your computer.
Aggregations group your documents into buckets and calculate metrics for each bucket. Use metric aggregations for data driven styling. For example, use the count aggregation to shade world countries by web log traffic.
You can add the following metric aggregations:
- Average. The mean of the values.
- Count. The number of documents.
- Max. The highest value.
- Min. The lowest value.
- Percentile. The value at which a certain percentage of observed values occur. For example, the 95th percentile is the value which is greater than 95% of the observed values.
- Sum. The total value.
- Top term. The most common value.
- Unique count. The number of distinct values.
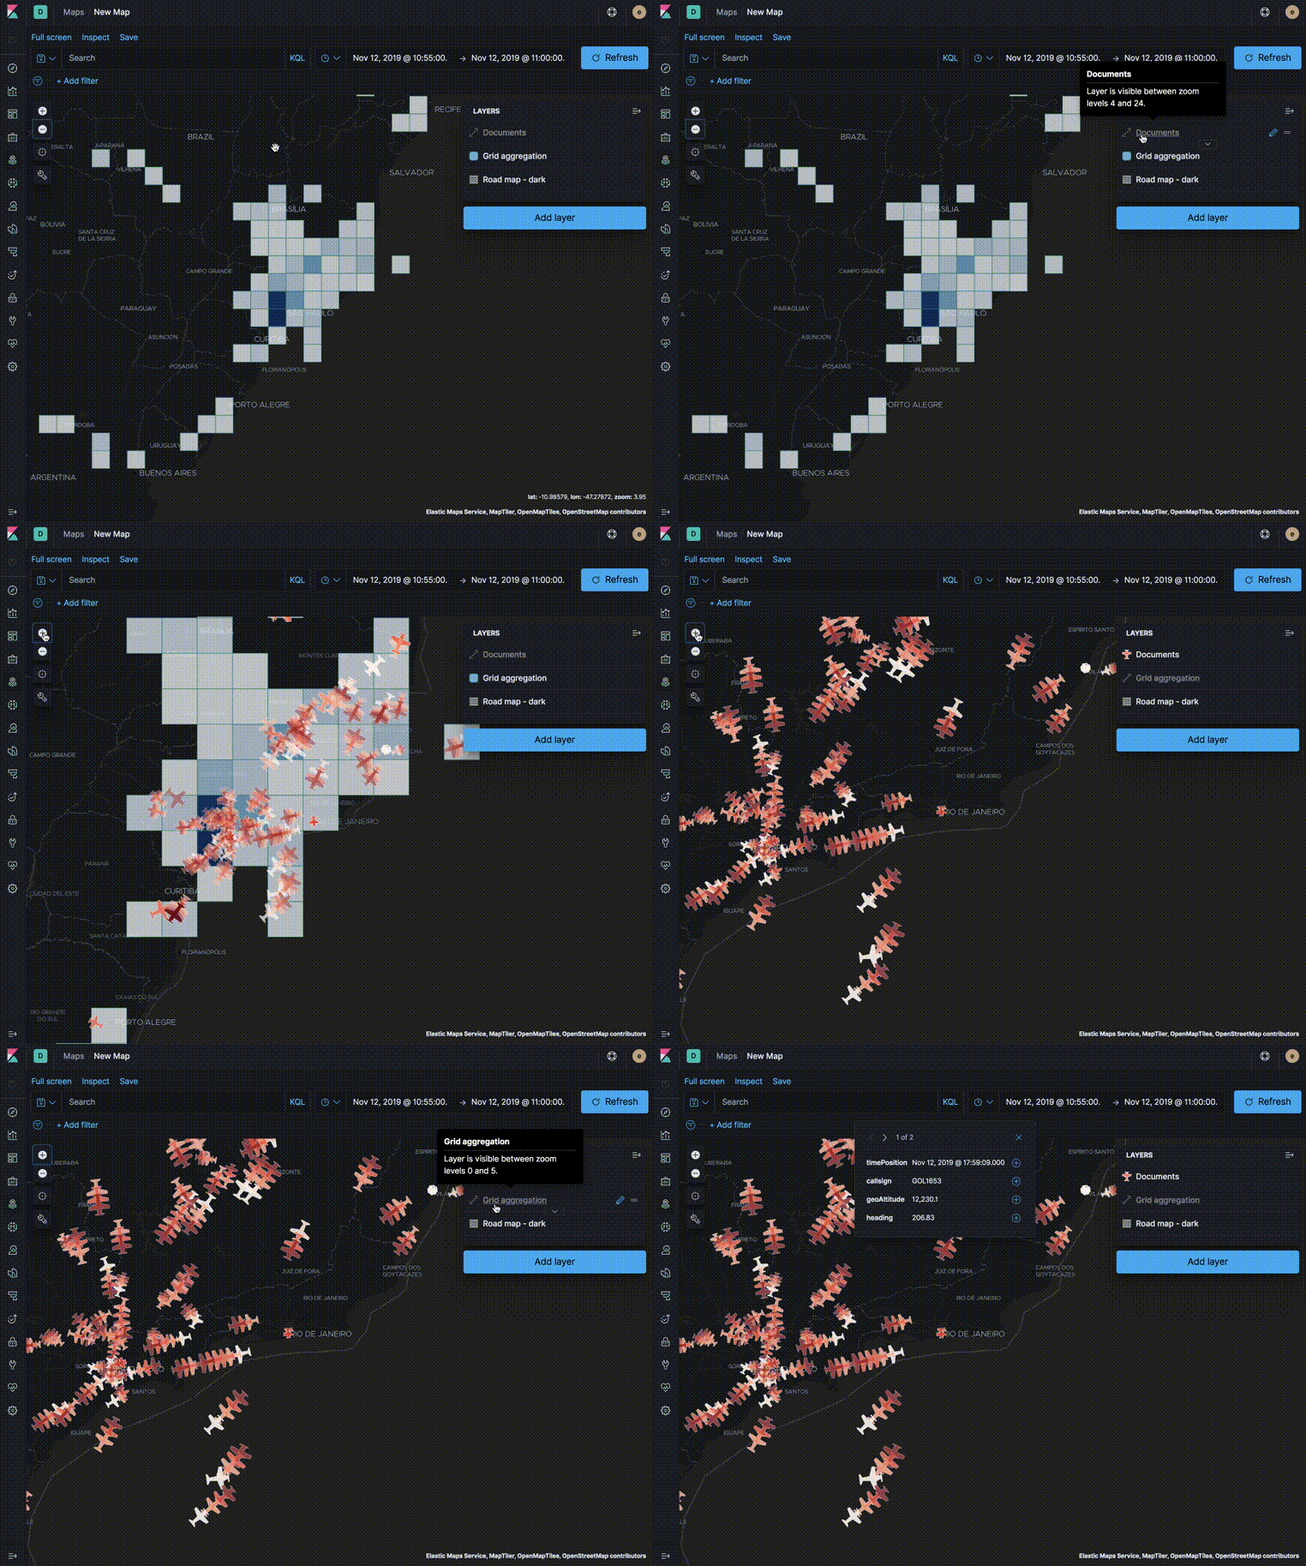
Use aggregated layers with document layers to show aggregated views when the map shows larger amounts of the globe and individual documents when the map shows smaller regions.
In the following example, the Grid aggregation layer is only visible when the map is at zoom levels 0 through 5. The Documents layer is only visible when the map is at zoom levels 4 through 24. See the Getting started tutorial for more details on configuring the layers.