Build mosaic charts with Kibana
Elastic Cloud Serverless projects are autoscaled environments, fully managed by Elastic and available on Elastic Cloud. Availability This functionality is generally available and ready for production usage. Serverless interfaces and procedures might differ from classic Elastic Stack deployments. The Elastic Stack includes Elastic's core products such as Elasticsearch, Kibana, Logstash, and Beats. Availability This functionality is generally available and ready for production usage. Unless stated otherwise on the page, this functionality is available when your Elastic Stack is deployed on Elastic Cloud Hosted, Elastic Cloud Enterprise, Elastic Cloud on Kubernetes, and self-managed environments. This documentation corresponds to the latest patch available for each minor version. If you're not using the latest patch, check the release notes for changes.
Serverless
Generally available
Stack
Generally available
Mosaic charts display the relationship between two categorical variables as a grid of rectangles, where both the width and height of each rectangle represent proportions of the data. They are ideal for visualizing how categories combine, showing conditional distributions, and exploring relationships between two dimensions. They work best with a moderate number of categories in each dimension (2-8 each).
You can build a mosaic chart in Kibana in either of these ways:
To automate chart or dashboard creation, use the Dashboards and Visualizations APIs. To create dashboards from natural-language instructions, use Elastic Agent Builder or the Kibana dashboards agent skill.
Before you start, make sure you have data indexed into Elasticsearch or install sample data. The point-and-click editor uses data views to access your Elasticsearch data. Data views are usually created automatically when you ingest data. You can also create one manually to select the data that you want.
To build a mosaic chart:
-
Lens is Kibana's main visualization editor. You can access it:
- From a dashboard: On the Dashboards page, open or create the dashboard where you want to add the visualization, then add a new visualization.
- From the Visualize library, by opening it and creating a new visualization.
-
New visualizations often start as Bar charts.
Using the Visualization type dropdown, select Mosaic.
-
- Select the data view that contains your data.
- Configure the Horizontal axis dimension to define the columns. The width of each column represents the proportion of data in that category.
- Configure the Vertical axis dimension to define the rows within each column. The height of each rectangle represents the proportion within that column.
- Configure the Metric dimension to define the value used to calculate rectangle sizes. This defaults to Count.
The chart preview updates to show a grid of rectangles. Column widths represent the proportion of each horizontal category, and rectangle heights within each column show the distribution of vertical categories.
-
- If you accessed Lens from a dashboard, select Save and return to save the visualization and add it to that dashboard, or select Save to library to add the visualization to the Visualize library and be able to add it to other dashboards later.
- If you accessed Lens from the Visualize library, select Save. A menu opens and lets you add the visualization to a dashboard and to the Visualize library.
Before you start, make sure you have data indexed into Elasticsearch or install sample data. ES|QL queries the indices named in the query directly, so you do not need a data view. The columns returned by the query become available as chart dimensions. Refer to Visualizations using ES|QL queries to learn how to open the editor, shape the query result for a visualization, and save the visualization.
A mosaic chart needs two categorical columns to form its grid and a numeric metric column to determine the rectangle proportions. In this query, BY returns one row for each operating system and response code combination, and COUNT provides its metric value:
FROM kibana_sample_data_logs
| STATS requests = COUNT(*) BY machine.os.keyword, response.keyword
To build the chart:
- Create an ES|QL visualization and run the query.
- Set the visualization type to Mosaic.
- Assign
machine.os.keywordto the Horizontal axis,response.keywordto the Vertical axis, andrequeststo Metric. - Customize the chart appearance using the mosaic chart settings.
- Select Apply and close.
The chart preview shows how response-code proportions vary between operating systems.
After building the chart with the point-and-click editor or an ES|QL query, customize its appearance for your data and audience:
- Limit categories
- Keep both dimensions to a maximum of 6-8 categories each. More categories create tiny rectangles that are hard to read.
- Ensure balanced proportions
- Mosaic charts work best when categories have roughly comparable sizes. If one category dominates (for example, one host handling 90% of traffic), the other columns become too narrow to read. In that case, consider using a bar chart instead.
- Order categories meaningfully
- Arrange categories in a logical order (by size, alphabetically, or by a natural order) to make patterns easier to identify.
- Use color for the vertical dimension
- Colors typically represent the vertical axis categories, making it easier to track how each category appears across columns.
Refer to Mosaic chart settings for all mosaic chart configuration options. For panel sizing and layout guidance, refer to Organize dashboard panels.
Customize your mosaic chart to display exactly the information you need, formatted the way you want.
The Horizontal axis dimension defines the columns of the mosaic. Column widths represent the proportion of each category. In the API, this corresponds to group_breakdown_by.
- Data
-
The Horizontal axis dimension supports the following functions:
- Top values: Show the most common values of a field.
- Field: Select the field to group by. You can add up to 4 fields to create multi-term groups. When multiple fields are selected, each group represents a unique combination of values across those fields. You can reorder the fields by dragging them to change their priority.
- Number of values: How many top values to display. The default number of values depends on your environment:
- Elastic Cloud Serverless projects are autoscaled environments, fully managed by Elastic and available on Elastic Cloud. Availability Generally available This functionality is generally available and ready for production usage. Serverless interfaces and procedures might differ from classic Elastic Stack deployments. The Elastic Stack includes Elastic's core products such as Elasticsearch, Kibana, Logstash, and Beats. Availability Generally available since 9.4 This functionality is generally available and ready for production usage. Unless stated otherwise on the page, this functionality is available when your Elastic Stack is deployed on Elastic Cloud Hosted, Elastic Cloud Enterprise, Elastic Cloud on Kubernetes, and self-managed environments. This documentation corresponds to the latest patch available for each minor version. If you're not using the latest patch, check the release notes for changes. Defaults to 9.
- The Elastic Stack includes Elastic's core products such as Elasticsearch, Kibana, Logstash, and Beats. Availability Generally available from 9.0 to 9.3 This functionality is generally available and ready for production usage. Unless stated otherwise on the page, this functionality is available when your Elastic Stack is deployed on Elastic Cloud Hosted, Elastic Cloud Enterprise, Elastic Cloud on Kubernetes, and self-managed environments. This documentation corresponds to the latest patch available for each minor version. If you're not using the latest patch, check the release notes for changes. Defaults to 5 for the first Top values dimension added to the chart and 3 for each additional one.
- Rank by: Specifies the dimension the top values are ranked by. Available options:
- Count of records: Rank by the number of documents containing each value. This is the default when a metric is defined.
- Alphabetical: Rank by the term key alphabetically. This is the default when no metric is defined.
- Rarity: Find terms that appear in very few documents, using a rare terms aggregation. You can configure the Max doc count per term to set the maximum number of documents a term can appear in to be considered rare (default: 1, max: 100). Available for single-field terms only, and not for floating-point numeric fields (
float,double,half_float, andscaled_float). - Significance: Find statistically unusual terms compared to the overall data set, using a significant terms aggregation. Only available for
keywordfields and single-field terms. - Custom: Define a custom metric aggregation to rank by (for example, rank by the sum of a numeric field rather than by count).
- Rank direction: Ascending or descending order. Disabled when Rank by is set to Rarity or Significance.
Advanced settings
Several advanced options allow you to refine the behavior of the breakdown:
- Include documents without the selected field: Off by default.
- Group remaining values as "Other": On by default.
- Enable accuracy mode: This option improves results for high-cardinality data, but increases the load on the Elasticsearch cluster.
- Include values: Values from the dimension to always include, even if they aren't among the top values. You can enter exact values or a regular expression.
- Exclude values: Values from the dimension to always exclude. You can enter exact values or a regular expression.
- Date histogram: Group data into time-based buckets.
- Field: Select the date field to use for the time-based grouping.
Include empty rows: Include buckets that contain no matching documents. Existing saved visualizations keep their configured setting.
The Elastic Stack includes Elastic's core products such as Elasticsearch, Kibana, Logstash, and Beats. Availability Generally available since 9.5 This functionality is generally available and ready for production usage. Unless stated otherwise on the page, this functionality is available when your Elastic Stack is deployed on Elastic Cloud Hosted, Elastic Cloud Enterprise, Elastic Cloud on Kubernetes, and self-managed environments. This documentation corresponds to the latest patch available for each minor version. If you're not using the latest patch, check the release notes for changes. Elastic Cloud Serverless projects are autoscaled environments, fully managed by Elastic and available on Elastic Cloud. Availability Generally available This functionality is generally available and ready for production usage. Serverless interfaces and procedures might differ from classic Elastic Stack deployments. For new visualizations, this option is:
- On by default for tables, line charts, and area charts
- Off by default for bar charts, heat maps, pie charts, treemap charts, mosaic charts, waffle charts, metric charts, and tag clouds
When you switch visualization or series type, Lens applies the default for the new type. If you switch back to the visualization type you saved, Lens restores the saved setting.
The Elastic Stack includes Elastic's core products such as Elasticsearch, Kibana, Logstash, and Beats. Availability Generally available from 9.0 to 9.4 This functionality is generally available and ready for production usage. Unless stated otherwise on the page, this functionality is available when your Elastic Stack is deployed on Elastic Cloud Hosted, Elastic Cloud Enterprise, Elastic Cloud on Kubernetes, and self-managed environments. This documentation corresponds to the latest patch available for each minor version. If you're not using the latest patch, check the release notes for changes. This option is on by default for all visualization types.
Bind to global time picker: Associate the selected field to the Lens or dashboard main time selector.
Minimum interval: Define the time interval for aggregating the data. For example,
30s,20m,24h,2d,1w,1MDrop partial intervals: Exclude incomplete intervals from the data. This option is off by default.
- Intervals: Create numeric ranges for continuous data by grouping a numeric field into buckets.
- Field: Select the numeric field to create intervals from.
- Intervals granularity: Use the slider to control how many intervals to create. Kibana divides the field into evenly spaced intervals (incremented by 10, 5, or 2) between the field's minimum and maximum values. The minimum granularity is 1, and the maximum is set by the
histogram:maxBarsadvanced setting. - Create custom ranges: Define your own ranges with specific lower and upper bounds and optional labels, instead of using the automatic granularity.
- Include empty rows: Include intervals that contain no matching documents. Existing saved visualizations keep their configured setting.
The Elastic Stack includes Elastic's core products such as Elasticsearch, Kibana, Logstash, and Beats. Availability Generally available since 9.5 This functionality is generally available and ready for production usage. Unless stated otherwise on the page, this functionality is available when your Elastic Stack is deployed on Elastic Cloud Hosted, Elastic Cloud Enterprise, Elastic Cloud on Kubernetes, and self-managed environments. This documentation corresponds to the latest patch available for each minor version. If you're not using the latest patch, check the release notes for changes. Elastic Cloud Serverless projects are autoscaled environments, fully managed by Elastic and available on Elastic Cloud. Availability Generally available This functionality is generally available and ready for production usage. Serverless interfaces and procedures might differ from classic Elastic Stack deployments. For new visualizations, this option is:
- On by default for tables, line charts, and area charts
- Off by default for bar charts, heat maps, pie charts, treemap charts, mosaic charts, waffle charts, metric charts, and tag clouds
When you switch visualization or series type, Lens applies the default for the new type. If you switch back to the visualization type you saved, Lens restores the saved setting.
The Elastic Stack includes Elastic's core products such as Elasticsearch, Kibana, Logstash, and Beats. Availability Generally available from 9.0 to 9.4 This functionality is generally available and ready for production usage. Unless stated otherwise on the page, this functionality is available when your Elastic Stack is deployed on Elastic Cloud Hosted, Elastic Cloud Enterprise, Elastic Cloud on Kubernetes, and self-managed environments. This documentation corresponds to the latest patch available for each minor version. If you're not using the latest patch, check the release notes for changes. This option is on by default for all visualization types.
- Filters: Define custom KQL filters. Each filter creates one group from the documents that match its query.
- Collapse by: Aggregate all metric values that share the same value for this dimension into a single number, removing it as an independent grouping. Available aggregation methods:
Sum,Min,Max, orAverage.
- Top values: Show the most common values of a field.
- Appearance
-
- Name: Customize the axis label.
- Value format: Control how numeric values are displayed (number, percent, bytes, and more).
The Vertical axis dimension defines the rows within each column. Rectangle heights represent the proportion of each category within the column. In the API, this corresponds to group_by, and color mapping is configured here.
- Data
-
The Vertical axis dimension supports the following functions:
- Top values: Show the most common values of a field.
- Field: Select the field to group by. You can add up to 4 fields to create multi-term groups. When multiple fields are selected, each group represents a unique combination of values across those fields. You can reorder the fields by dragging them to change their priority.
- Number of values: How many top values to display. The default number of values depends on your environment:
- Elastic Cloud Serverless projects are autoscaled environments, fully managed by Elastic and available on Elastic Cloud. Availability Generally available This functionality is generally available and ready for production usage. Serverless interfaces and procedures might differ from classic Elastic Stack deployments. The Elastic Stack includes Elastic's core products such as Elasticsearch, Kibana, Logstash, and Beats. Availability Generally available since 9.4 This functionality is generally available and ready for production usage. Unless stated otherwise on the page, this functionality is available when your Elastic Stack is deployed on Elastic Cloud Hosted, Elastic Cloud Enterprise, Elastic Cloud on Kubernetes, and self-managed environments. This documentation corresponds to the latest patch available for each minor version. If you're not using the latest patch, check the release notes for changes. Defaults to 9.
- The Elastic Stack includes Elastic's core products such as Elasticsearch, Kibana, Logstash, and Beats. Availability Generally available from 9.0 to 9.3 This functionality is generally available and ready for production usage. Unless stated otherwise on the page, this functionality is available when your Elastic Stack is deployed on Elastic Cloud Hosted, Elastic Cloud Enterprise, Elastic Cloud on Kubernetes, and self-managed environments. This documentation corresponds to the latest patch available for each minor version. If you're not using the latest patch, check the release notes for changes. Defaults to 5 for the first Top values dimension added to the chart and 3 for each additional one.
- Rank by: Specifies the dimension the top values are ranked by. Available options:
- Count of records: Rank by the number of documents containing each value. This is the default when a metric is defined.
- Alphabetical: Rank by the term key alphabetically. This is the default when no metric is defined.
- Rarity: Find terms that appear in very few documents, using a rare terms aggregation. You can configure the Max doc count per term to set the maximum number of documents a term can appear in to be considered rare (default: 1, max: 100). Available for single-field terms only, and not for floating-point numeric fields (
float,double,half_float, andscaled_float). - Significance: Find statistically unusual terms compared to the overall data set, using a significant terms aggregation. Only available for
keywordfields and single-field terms. - Custom: Define a custom metric aggregation to rank by (for example, rank by the sum of a numeric field rather than by count).
- Rank direction: Ascending or descending order. Disabled when Rank by is set to Rarity or Significance.
Advanced settings
Several advanced options allow you to refine the behavior of the breakdown:
- Include documents without the selected field: Off by default.
- Group remaining values as "Other": On by default.
- Enable accuracy mode: This option improves results for high-cardinality data, but increases the load on the Elasticsearch cluster.
- Include values: Values from the dimension to always include, even if they aren't among the top values. You can enter exact values or a regular expression.
- Exclude values: Values from the dimension to always exclude. You can enter exact values or a regular expression.
- Date histogram: Group data into time-based buckets.
- Field: Select the date field to use for the time-based grouping.
Include empty rows: Include buckets that contain no matching documents. Existing saved visualizations keep their configured setting.
The Elastic Stack includes Elastic's core products such as Elasticsearch, Kibana, Logstash, and Beats. Availability Generally available since 9.5 This functionality is generally available and ready for production usage. Unless stated otherwise on the page, this functionality is available when your Elastic Stack is deployed on Elastic Cloud Hosted, Elastic Cloud Enterprise, Elastic Cloud on Kubernetes, and self-managed environments. This documentation corresponds to the latest patch available for each minor version. If you're not using the latest patch, check the release notes for changes. Elastic Cloud Serverless projects are autoscaled environments, fully managed by Elastic and available on Elastic Cloud. Availability Generally available This functionality is generally available and ready for production usage. Serverless interfaces and procedures might differ from classic Elastic Stack deployments. For new visualizations, this option is:
- On by default for tables, line charts, and area charts
- Off by default for bar charts, heat maps, pie charts, treemap charts, mosaic charts, waffle charts, metric charts, and tag clouds
When you switch visualization or series type, Lens applies the default for the new type. If you switch back to the visualization type you saved, Lens restores the saved setting.
The Elastic Stack includes Elastic's core products such as Elasticsearch, Kibana, Logstash, and Beats. Availability Generally available from 9.0 to 9.4 This functionality is generally available and ready for production usage. Unless stated otherwise on the page, this functionality is available when your Elastic Stack is deployed on Elastic Cloud Hosted, Elastic Cloud Enterprise, Elastic Cloud on Kubernetes, and self-managed environments. This documentation corresponds to the latest patch available for each minor version. If you're not using the latest patch, check the release notes for changes. This option is on by default for all visualization types.
Bind to global time picker: Associate the selected field to the Lens or dashboard main time selector.
Minimum interval: Define the time interval for aggregating the data. For example,
30s,20m,24h,2d,1w,1MDrop partial intervals: Exclude incomplete intervals from the data. This option is off by default.
- Intervals: Create numeric ranges for continuous data by grouping a numeric field into buckets.
- Field: Select the numeric field to create intervals from.
- Intervals granularity: Use the slider to control how many intervals to create. Kibana divides the field into evenly spaced intervals (incremented by 10, 5, or 2) between the field's minimum and maximum values. The minimum granularity is 1, and the maximum is set by the
histogram:maxBarsadvanced setting. - Create custom ranges: Define your own ranges with specific lower and upper bounds and optional labels, instead of using the automatic granularity.
- Include empty rows: Include intervals that contain no matching documents. Existing saved visualizations keep their configured setting.
The Elastic Stack includes Elastic's core products such as Elasticsearch, Kibana, Logstash, and Beats. Availability Generally available since 9.5 This functionality is generally available and ready for production usage. Unless stated otherwise on the page, this functionality is available when your Elastic Stack is deployed on Elastic Cloud Hosted, Elastic Cloud Enterprise, Elastic Cloud on Kubernetes, and self-managed environments. This documentation corresponds to the latest patch available for each minor version. If you're not using the latest patch, check the release notes for changes. Elastic Cloud Serverless projects are autoscaled environments, fully managed by Elastic and available on Elastic Cloud. Availability Generally available This functionality is generally available and ready for production usage. Serverless interfaces and procedures might differ from classic Elastic Stack deployments. For new visualizations, this option is:
- On by default for tables, line charts, and area charts
- Off by default for bar charts, heat maps, pie charts, treemap charts, mosaic charts, waffle charts, metric charts, and tag clouds
When you switch visualization or series type, Lens applies the default for the new type. If you switch back to the visualization type you saved, Lens restores the saved setting.
The Elastic Stack includes Elastic's core products such as Elasticsearch, Kibana, Logstash, and Beats. Availability Generally available from 9.0 to 9.4 This functionality is generally available and ready for production usage. Unless stated otherwise on the page, this functionality is available when your Elastic Stack is deployed on Elastic Cloud Hosted, Elastic Cloud Enterprise, Elastic Cloud on Kubernetes, and self-managed environments. This documentation corresponds to the latest patch available for each minor version. If you're not using the latest patch, check the release notes for changes. This option is on by default for all visualization types.
- Filters: Define custom KQL filters. Each filter creates one group from the documents that match its query.
- Collapse by: Aggregate all metric values that share the same value for this dimension into a single number, removing it as an independent grouping. Available aggregation methods:
Sum,Min,Max, orAverage.
- Top values: Show the most common values of a field.
- Appearance
-
- Name: Customize the axis label.
- Color mapping: Select a color palette or assign specific colors to categories. Refer to Assign colors to terms for details.
The Metric dimension defines the value used to calculate rectangle sizes. In mosaic charts, this is typically Count.
- Data
-
The value that determines rectangle proportions. You can use aggregation functions like
CountorSum, or create custom calculations with formulas.Advanced settings
Depending on the data you defined, several options allow you to apply additional filtering to the data taken into account to compute the final value to show.
Based on the type of visualization you're creating, only some of the following options can be available:
- Normalize by unit: Normalize the metric values to show per unit of time.
- Filter by: Specify a query.
- Reduced time range: Reduce the time range specified on the dashboard's time filter by the specified duration.
- Time shift: Shift the time range by the specified duration. This is useful if the value should use a different time range than the one selected on the dashboard.
- Hide zero values: Don't show values equal to zero. This option is on by default.
- Appearance
-
- Name: Customize the metric label displayed in tooltips and legends.
- Value format: Control how numeric values are displayed (number, percent, bytes, and more).
NoteMosaic charts do not support multiple metrics. Each cell represents a single count or aggregated value.
When creating or editing a visualization, you can customize several appearance options from the
Style or  Legend menus.
- Slice values
-
Control what values appear on rectangles:
- Percentage: Display the percentage of total (default).
- Integer: Display the raw numeric value.
- Hide: Do not display values.
When displaying percentages, you can also configure the Decimal places (default: 2).
- Visibility
-
Specify whether to automatically show the legend or hide it:
- Auto: Show the legend when there are multiple categories.
- Show: Always show the legend.
- Hide: Never show the legend (default).
- Width
-
Control the width of the legend panel. Select Auto, Small, Medium, Large, or Extra large. Auto sizes the legend to fit its labels, and the other options set a fixed width. The default and available options depend on your environment:
- Elastic Cloud Serverless projects are autoscaled environments, fully managed by Elastic and available on Elastic Cloud. Availability Generally available This functionality is generally available and ready for production usage. Serverless interfaces and procedures might differ from classic Elastic Stack deployments. The Elastic Stack includes Elastic's core products such as Elasticsearch, Kibana, Logstash, and Beats. Availability Planned We plan to add this functionality in a future Elastic Stack update. Subject to changes. Unless stated otherwise on the page, this functionality is available when your Elastic Stack is deployed on Elastic Cloud Hosted, Elastic Cloud Enterprise, Elastic Cloud on Kubernetes, and self-managed environments. This documentation corresponds to the latest patch available for each minor version. If you're not using the latest patch, check the release notes for changes. Auto is the default.
- The Elastic Stack includes Elastic's core products such as Elasticsearch, Kibana, Logstash, and Beats. Availability Generally available from 9.0 to 9.5 This functionality is generally available and ready for production usage. Unless stated otherwise on the page, this functionality is available when your Elastic Stack is deployed on Elastic Cloud Hosted, Elastic Cloud Enterprise, Elastic Cloud on Kubernetes, and self-managed environments. This documentation corresponds to the latest patch available for each minor version. If you're not using the latest patch, check the release notes for changes. Medium is the default. Auto is available in the interface only for charts whose width is already set to Auto, for example charts created with the API, or charts created before 8.3 that had no width set.
- Nested
- When using both horizontal and vertical axes, enable this option to show the legend in a hierarchical format.
- Label truncation
- Toggle whether to truncate long legend labels. When enabled, set the Line limit to control how many lines to display before truncating (1-5, default: 1).
The following examples show various configuration options for building impactful mosaic charts.
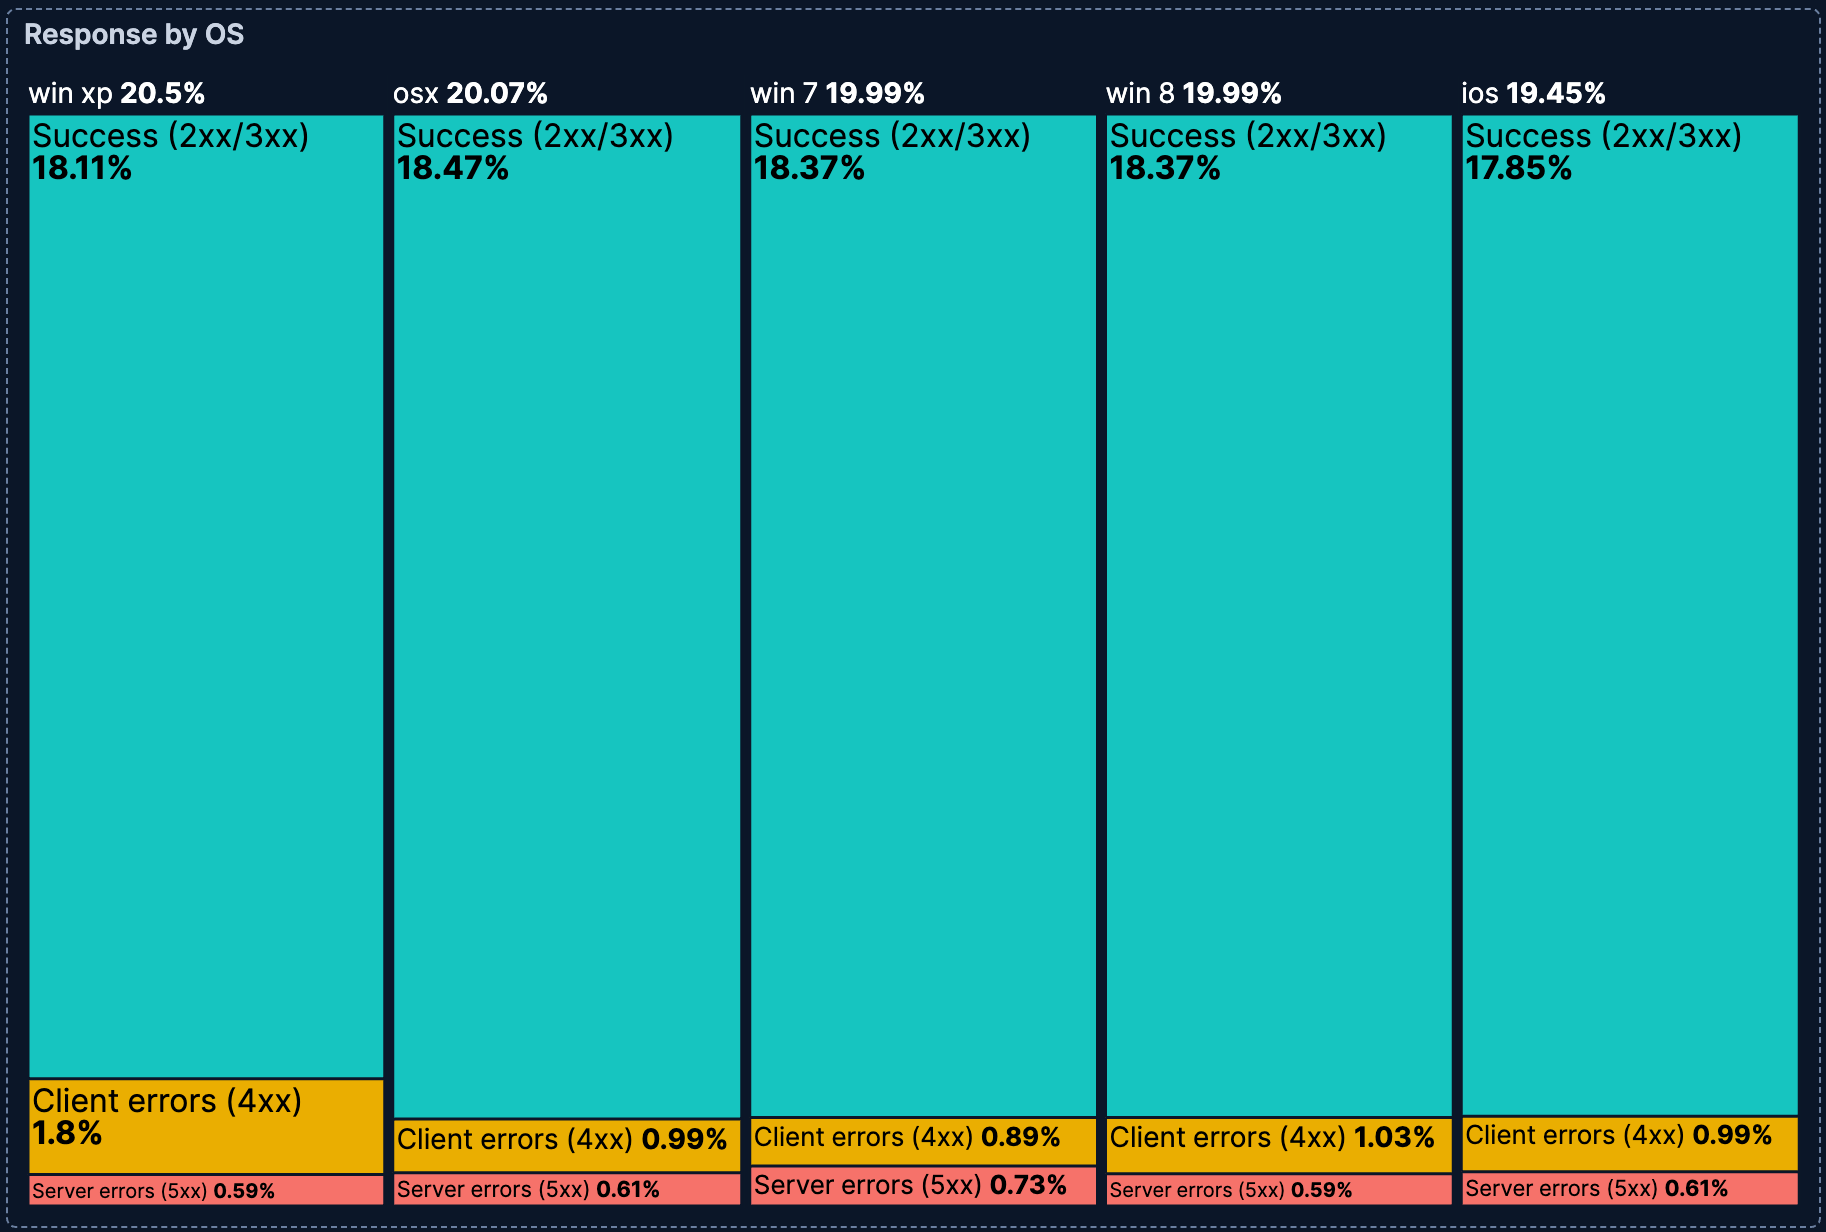
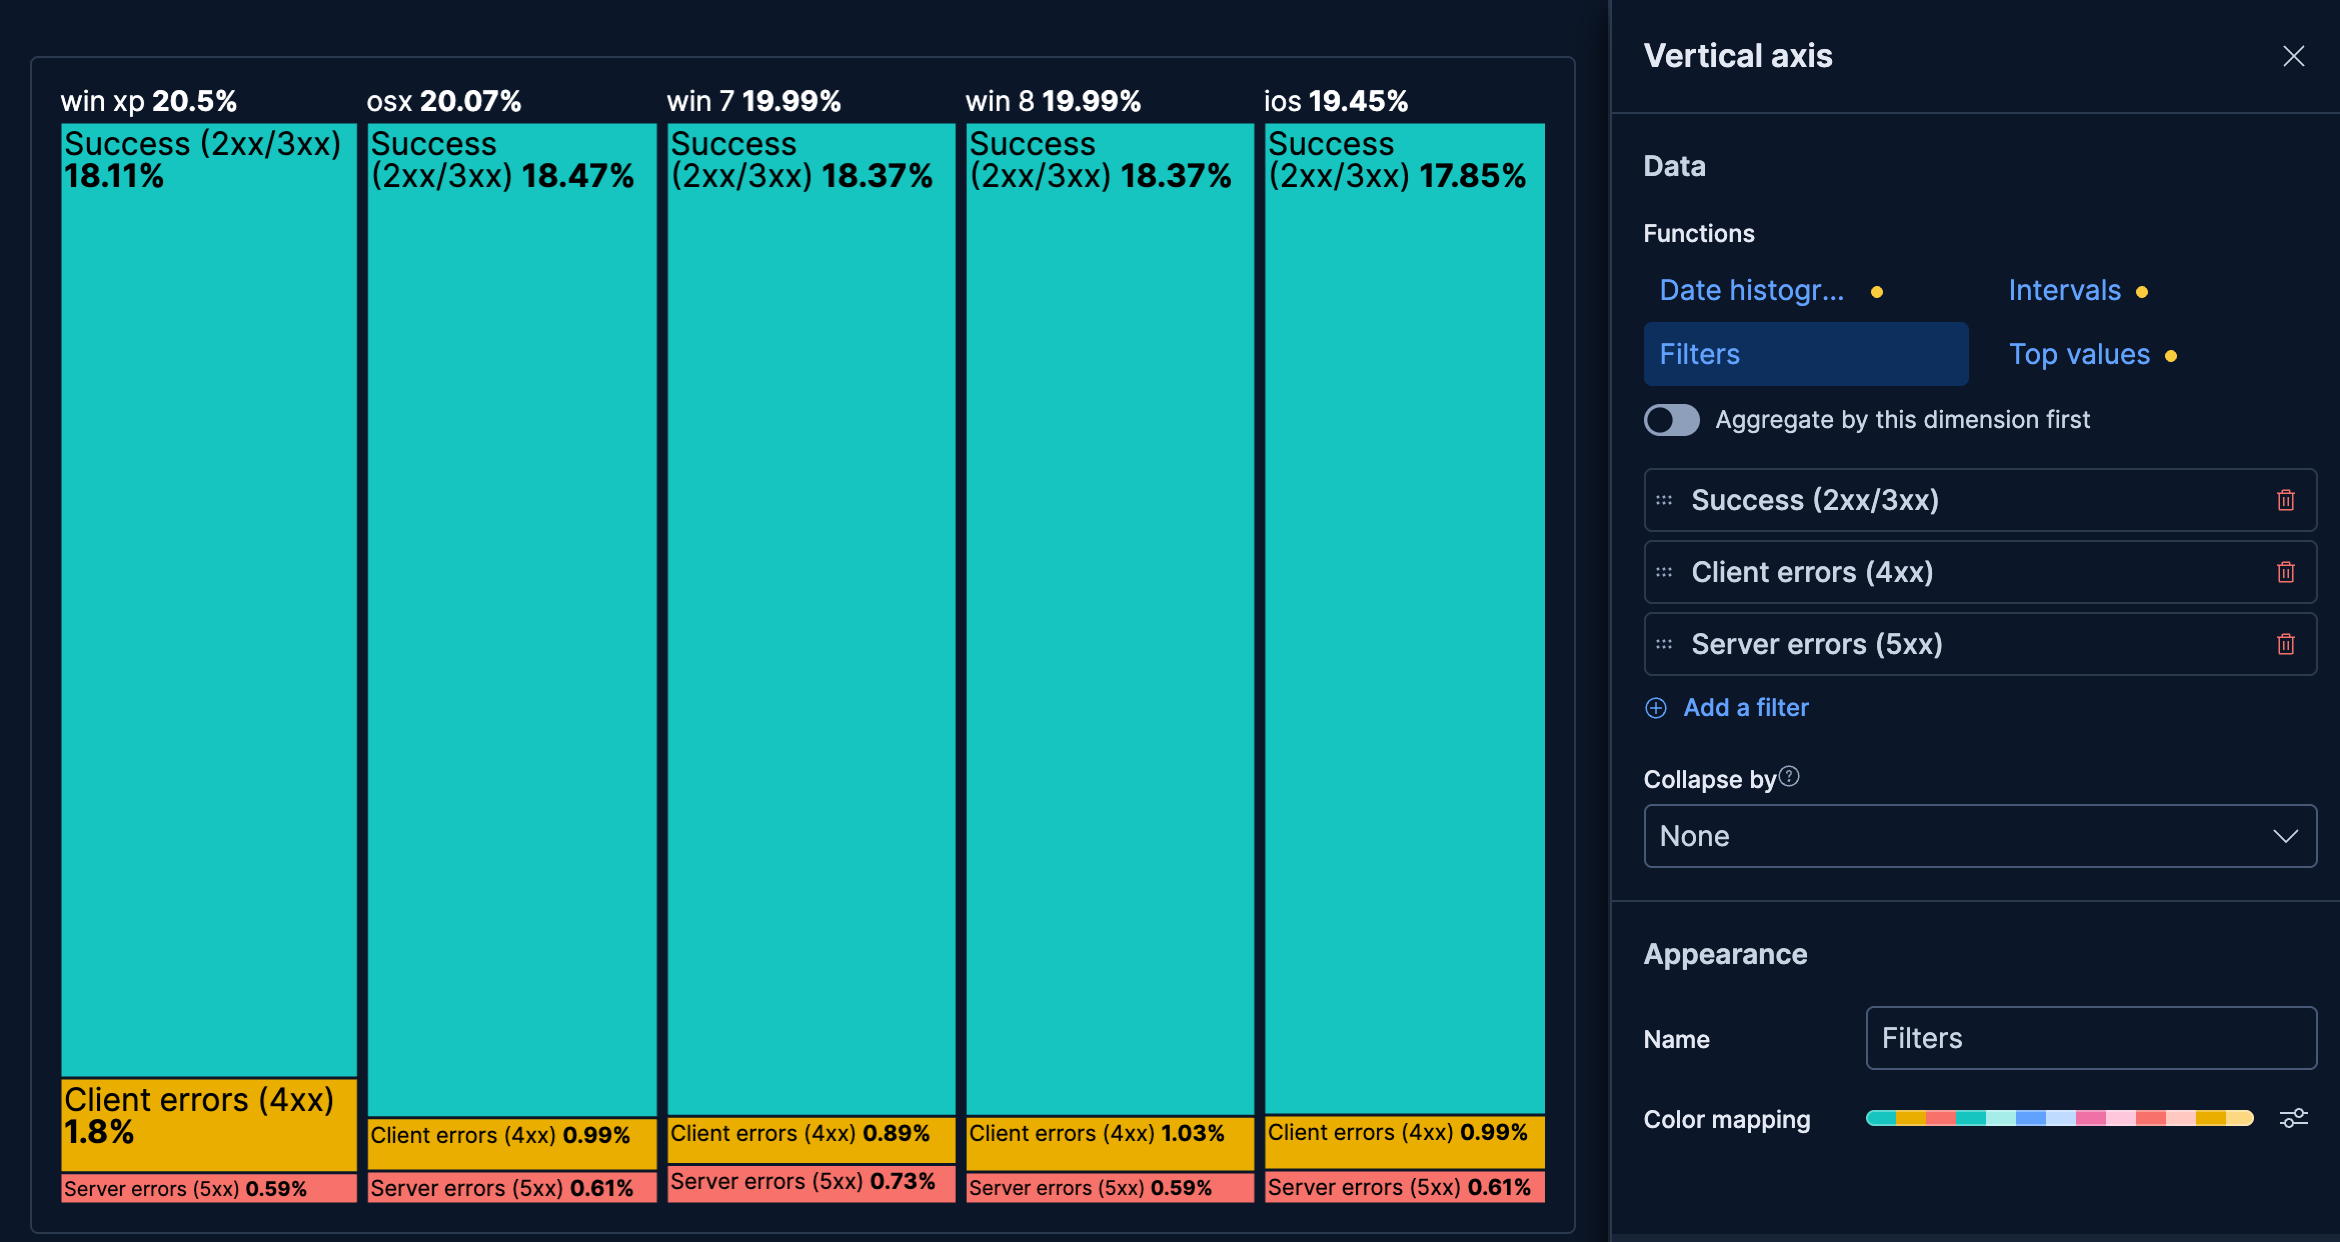
- Response status by operating system
-
Visualize how response status categories vary across operating systems:
- Example based on: Kibana Sample Data Logs
- Horizontal axis (columns):
machine.os.keyword(Top 5 values) - Vertical axis (rows): Filters
- "Success (2xx/3xx)":
response.keyword >= "200" AND response.keyword < "400" - "Client errors (4xx)":
response.keyword >= "400" AND response.keyword < "500" - "Server errors (5xx)":
response.keyword >= "500"
- "Success (2xx/3xx)":
- Metric: Count
- Color mapping: Teal for success, pink for client errors, red for server errors
Serverless Stack GA 9.5+ … Create this chart using the API
This example creates a mosaic chart where column widths represent OS popularity and the colored rows within each column show the proportion of success, client error, and server error responses.
These API request examples are kept up to date with the latest version of the APIs, so some fields might differ if you're using an earlier version. For a history of breaking changes, refer to the Kibana breaking changes or the Elastic Cloud Serverless breaking changes.
POST kbn://api/visualizations{ "type": "mosaic", "title": "Response status by operating system", "filters": [], "query": { "expression": "" }, "legend": { "visibility": "auto", "nested": false }, "metric": { "operation": "count", "empty_as_null": true }, "group_by": [ { "operation": "filters", "filters": [ { "filter": { "expression": "response.keyword >= \"200\" AND response.keyword < \"400\"" }, "label": "Success (2xx/3xx)" }, { "filter": { "expression": "response.keyword >= \"400\" AND response.keyword < \"500\"" }, "label": "Client errors (4xx)" }, { "filter": { "expression": "response.keyword >= \"500\"" }, "label": "Server errors (5xx)" } ], "color": { "mode": "categorical", "palette": "default", "mapping": [ { "values": ["Success (2xx/3xx)"], "color": { "type": "from_palette", "palette": "default", "index": 0 } }, { "values": ["Client errors (4xx)"], "color": { "type": "from_palette", "palette": "default", "index": 8 } }, { "values": ["Server errors (5xx)"], "color": { "type": "from_palette", "palette": "default", "index": 6 } } ] } } ], "group_breakdown_by": [ { "operation": "terms", "fields": ["machine.os.keyword"], "limit": 5, "other_bucket": { "include_documents_without_field": false }, "rank_by": { "type": "metric", "metric_index": 0, "direction": "desc" } } ], "data_source": { "type": "data_view_spec", "index_pattern": "kibana_sample_data_logs", "time_field": "timestamp" }, "styling": { "values": { "visible": true, "mode": "percentage" } } }
mosaicrenders a grid where both column width and row height encode proportions, making distribution comparisons clear across two dimensions.group_bydefines the vertical axis (rows). Usingfiltershere creates three named rows — one per response status category — each colored from themappingso success, client errors, and server errors are immediately distinguishable.group_breakdown_bydefines the horizontal axis (columns). Each OS becomes a column whose width reflects its share of total traffic.
curl -X POST "${KIBANA_URL}/api/visualizations" \
  -H "Authorization: ApiKey ${API_KEY}" \
  -H "kbn-xsrf: true" \
  -H "Content-Type: application/json" \
  -d '{
  "type": "mosaic",
  "title": "Response status by operating system",
  "filters": [],
  "query": { "expression": "" },
  "legend": { "visibility": "auto", "nested": false },
  "metric": { "operation": "count", "empty_as_null": true },
  "group_by": [
    {
      "operation": "filters",
      "filters": [
        {
          "filter": { "expression": "response.keyword >= \"200\" AND response.keyword < \"400\"" },
          "label": "Success (2xx/3xx)"
        },
        {
          "filter": { "expression": "response.keyword >= \"400\" AND response.keyword < \"500\"" },
          "label": "Client errors (4xx)"
        },
        {
          "filter": { "expression": "response.keyword >= \"500\"" },
          "label": "Server errors (5xx)"
        }
      ],
      "color": {
        "mode": "categorical",
        "palette": "default",
        "mapping": [
          { "values": ["Success (2xx/3xx)"], "color": { "type": "from_palette", "palette": "default", "index": 0 } },
          { "values": ["Client errors (4xx)"], "color": { "type": "from_palette", "palette": "default", "index": 8 } },
          { "values": ["Server errors (5xx)"], "color": { "type": "from_palette", "palette": "default", "index": 6 } }
        ]
      }
    }
  ],
  "group_breakdown_by": [
    {
      "operation": "terms",
      "fields": ["machine.os.keyword"],
      "limit": 5,
      "other_bucket": { "include_documents_without_field": false },
      "rank_by": { "type": "metric", "metric_index": 0, "direction": "desc" }
    }
  ],
  "data_source": {
    "type": "data_view_spec",
    "index_pattern": "kibana_sample_data_logs",
    "time_field": "timestamp"
  },
  "styling": { "values": { "visible": true, "mode": "percentage" } }
}'
mosaicrenders a grid where both column width and row height encode proportions, making distribution comparisons clear across two dimensions.group_bydefines the vertical axis (rows). Usingfiltershere creates three named rows — one per response status category — each colored from themappingso success, client errors, and server errors are immediately distinguishable.group_breakdown_bydefines the horizontal axis (columns). Each OS becomes a column whose width reflects its share of total traffic.
For more information, refer to the Visualizations API.
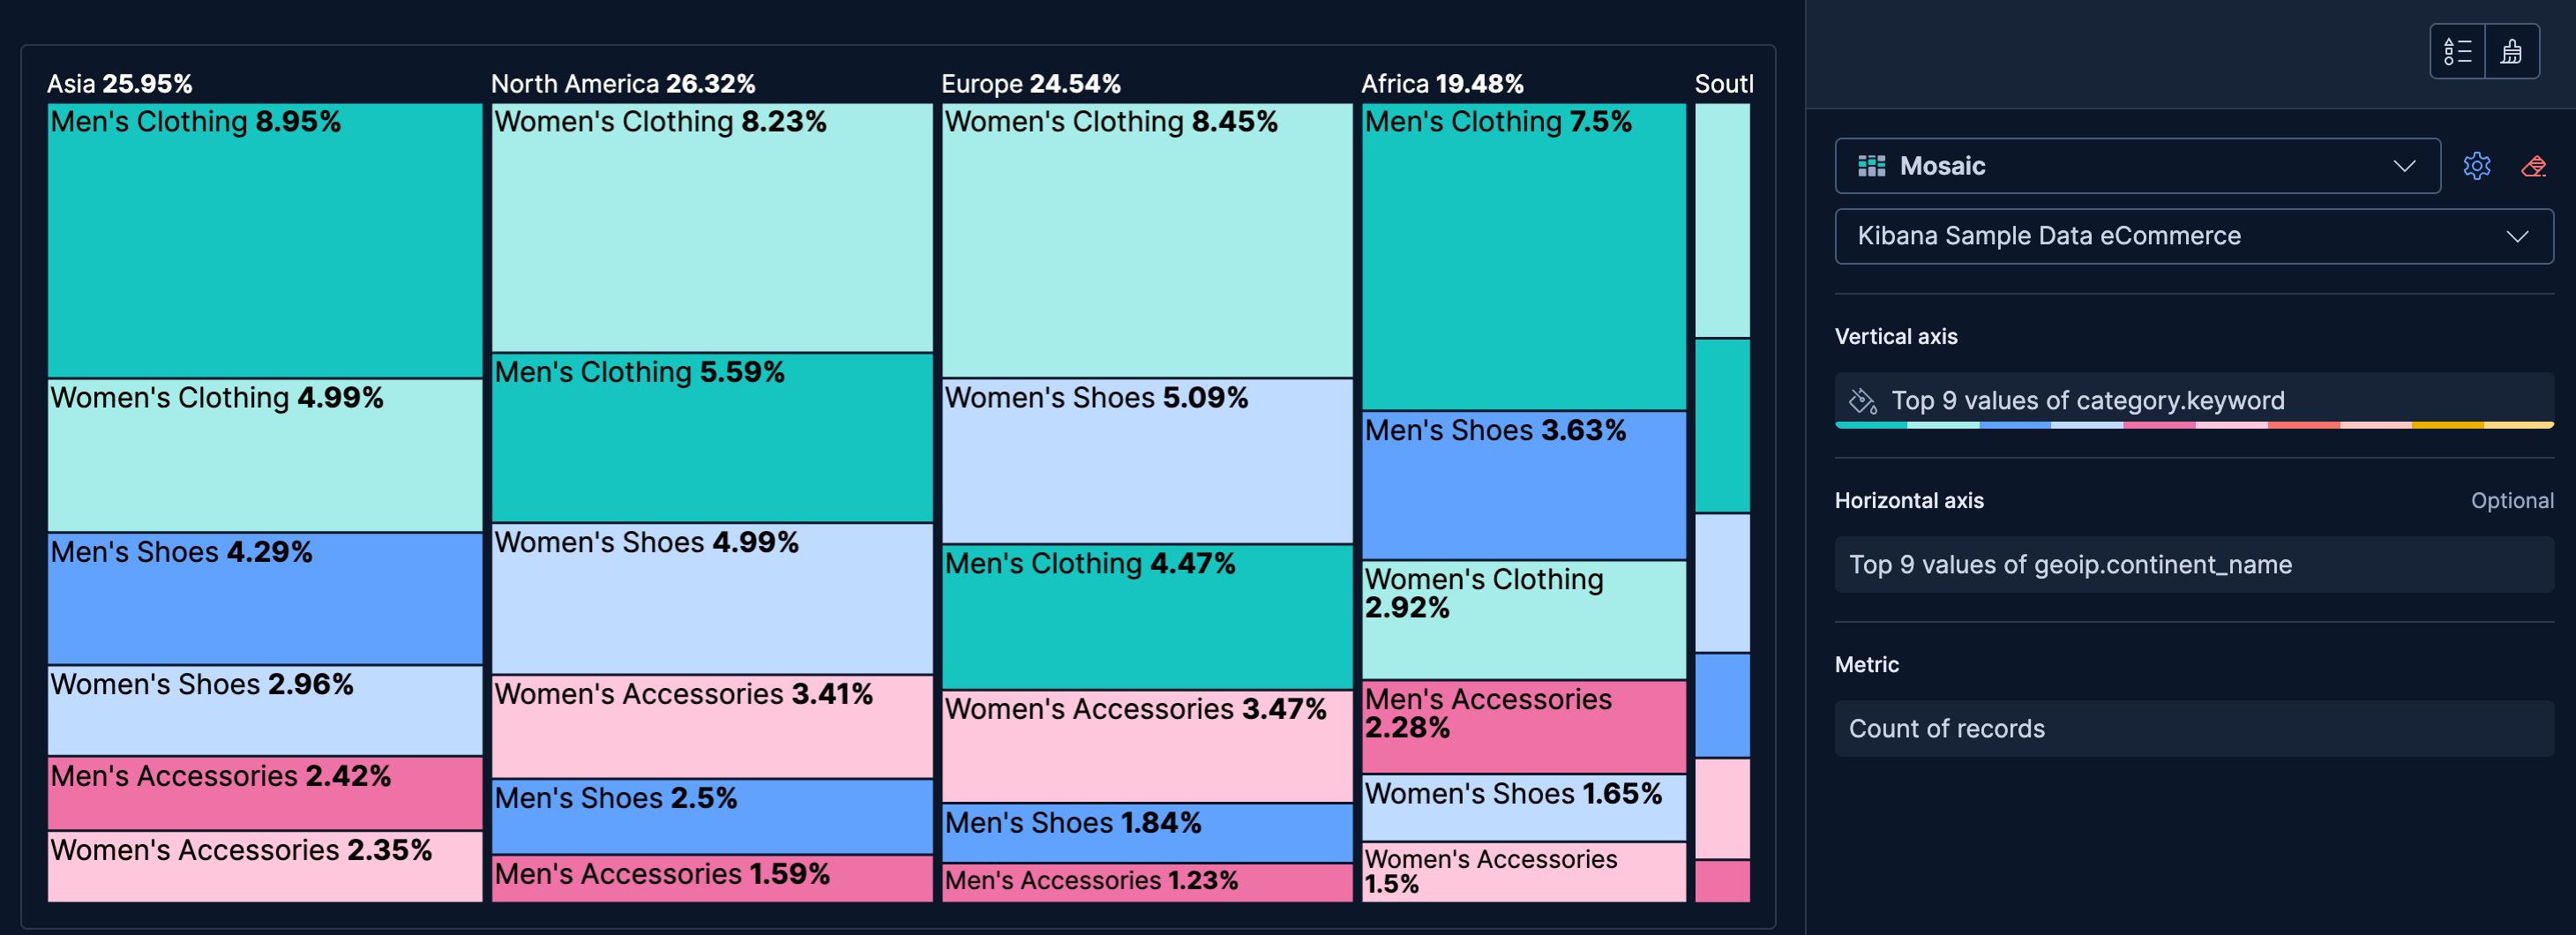
- Product categories by continent
-
Show how product preferences vary across regions:
- Example based on: Kibana Sample Data eCommerce
- Horizontal axis (columns):
geoip.continent_name(Top values) - Vertical axis (rows):
category.keyword(Top 9 values) - Metric: Count
Serverless Stack GA 9.5+ … Create this chart using the API
This example uses terms on both axes to compare product category preferences across continents, revealing how shopping behavior varies by region.
These API request examples are kept up to date with the latest version of the APIs, so some fields might differ if you're using an earlier version. For a history of breaking changes, refer to the Kibana breaking changes or the Elastic Cloud Serverless breaking changes.
POST kbn://api/visualizations{ "type": "mosaic", "title": "Product categories by continent", "filters": [], "query": { "expression": "" }, "legend": { "visibility": "auto", "nested": false }, "metric": { "operation": "count", "empty_as_null": true }, "group_by": [ { "operation": "terms", "fields": ["category.keyword"], "limit": 9, "other_bucket": { "include_documents_without_field": false }, "rank_by": { "type": "metric", "metric_index": 0, "direction": "desc" }, "color": { "mode": "categorical", "palette": "default", "mapping": [] } } ], "group_breakdown_by": [ { "operation": "terms", "fields": ["geoip.continent_name"], "limit": 9, "other_bucket": { "include_documents_without_field": false }, "rank_by": { "type": "metric", "metric_index": 0, "direction": "desc" } } ], "data_source": { "type": "data_view_spec", "index_pattern": "kibana_sample_data_ecommerce", "time_field": "order_date" }, "styling": { "values": { "visible": true, "mode": "percentage" } } }
category.keywordon the vertical axis (group_by) creates one row per product category. Thecolormapping assigns a distinct palette color to each category, making each category trackable across columns.geoip.continent_nameon the horizontal axis (group_breakdown_by) creates one column per continent, with width proportional to order volume from that region.
curl -X POST "${KIBANA_URL}/api/visualizations" \
  -H "Authorization: ApiKey ${API_KEY}" \
  -H "kbn-xsrf: true" \
  -H "Content-Type: application/json" \
  -d '{
  "type": "mosaic",
  "title": "Product categories by continent",
  "filters": [],
  "query": { "expression": "" },
  "legend": { "visibility": "auto", "nested": false },
  "metric": { "operation": "count", "empty_as_null": true },
  "group_by": [
    {
      "operation": "terms",
      "fields": ["category.keyword"],
      "limit": 9,
      "other_bucket": { "include_documents_without_field": false },
      "rank_by": { "type": "metric", "metric_index": 0, "direction": "desc" },
      "color": { "mode": "categorical", "palette": "default", "mapping": [] }
    }
  ],
  "group_breakdown_by": [
    {
      "operation": "terms",
      "fields": ["geoip.continent_name"],
      "limit": 9,
      "other_bucket": { "include_documents_without_field": false },
      "rank_by": { "type": "metric", "metric_index": 0, "direction": "desc" }
    }
  ],
  "data_source": {
    "type": "data_view_spec",
    "index_pattern": "kibana_sample_data_ecommerce",
    "time_field": "order_date"
  },
  "styling": { "values": { "visible": true, "mode": "percentage" } }
}'
category.keywordon the vertical axis (group_by) creates one row per product category. Thecolormapping assigns a distinct palette color to each category, making each category trackable across columns.geoip.continent_nameon the horizontal axis (group_breakdown_by) creates one column per continent, with width proportional to order volume from that region.
For more information, refer to the Visualizations API.