Kibana dashboards
Elastic Cloud Serverless projects are autoscaled environments, fully managed by Elastic and available on Elastic Cloud. Availability This functionality is generally available and ready for production usage. Serverless interfaces and procedures might differ from classic Elastic Stack deployments. The Elastic Stack includes Elastic's core products such as Elasticsearch, Kibana, Logstash, and Beats. Availability This functionality is generally available and ready for production usage. Unless stated otherwise on the page, this functionality is available when your Elastic Stack is deployed on Elastic Cloud Hosted, Elastic Cloud Enterprise, Elastic Cloud on Kubernetes, and self-managed environments. This documentation corresponds to the latest patch available for each minor version. If you're not using the latest patch, check the release notes for changes.
Serverless
Generally available
Stack
Generally available
Kibana dashboards provide the primary way to visualize and share insights from your Elasticsearch data. They allow you to build interactive displays that combine multiple visualizations, metrics, and controls into a single view that helps you and your team monitor trends, investigate issues, and make data-driven decisions.
A dashboard is composed of one or more panels that you arrange to tell your data story. Each panel can display visualizations such as charts, tables, metrics, and maps, static annotations like text or images, or specialized views for machine learning or Observability data.
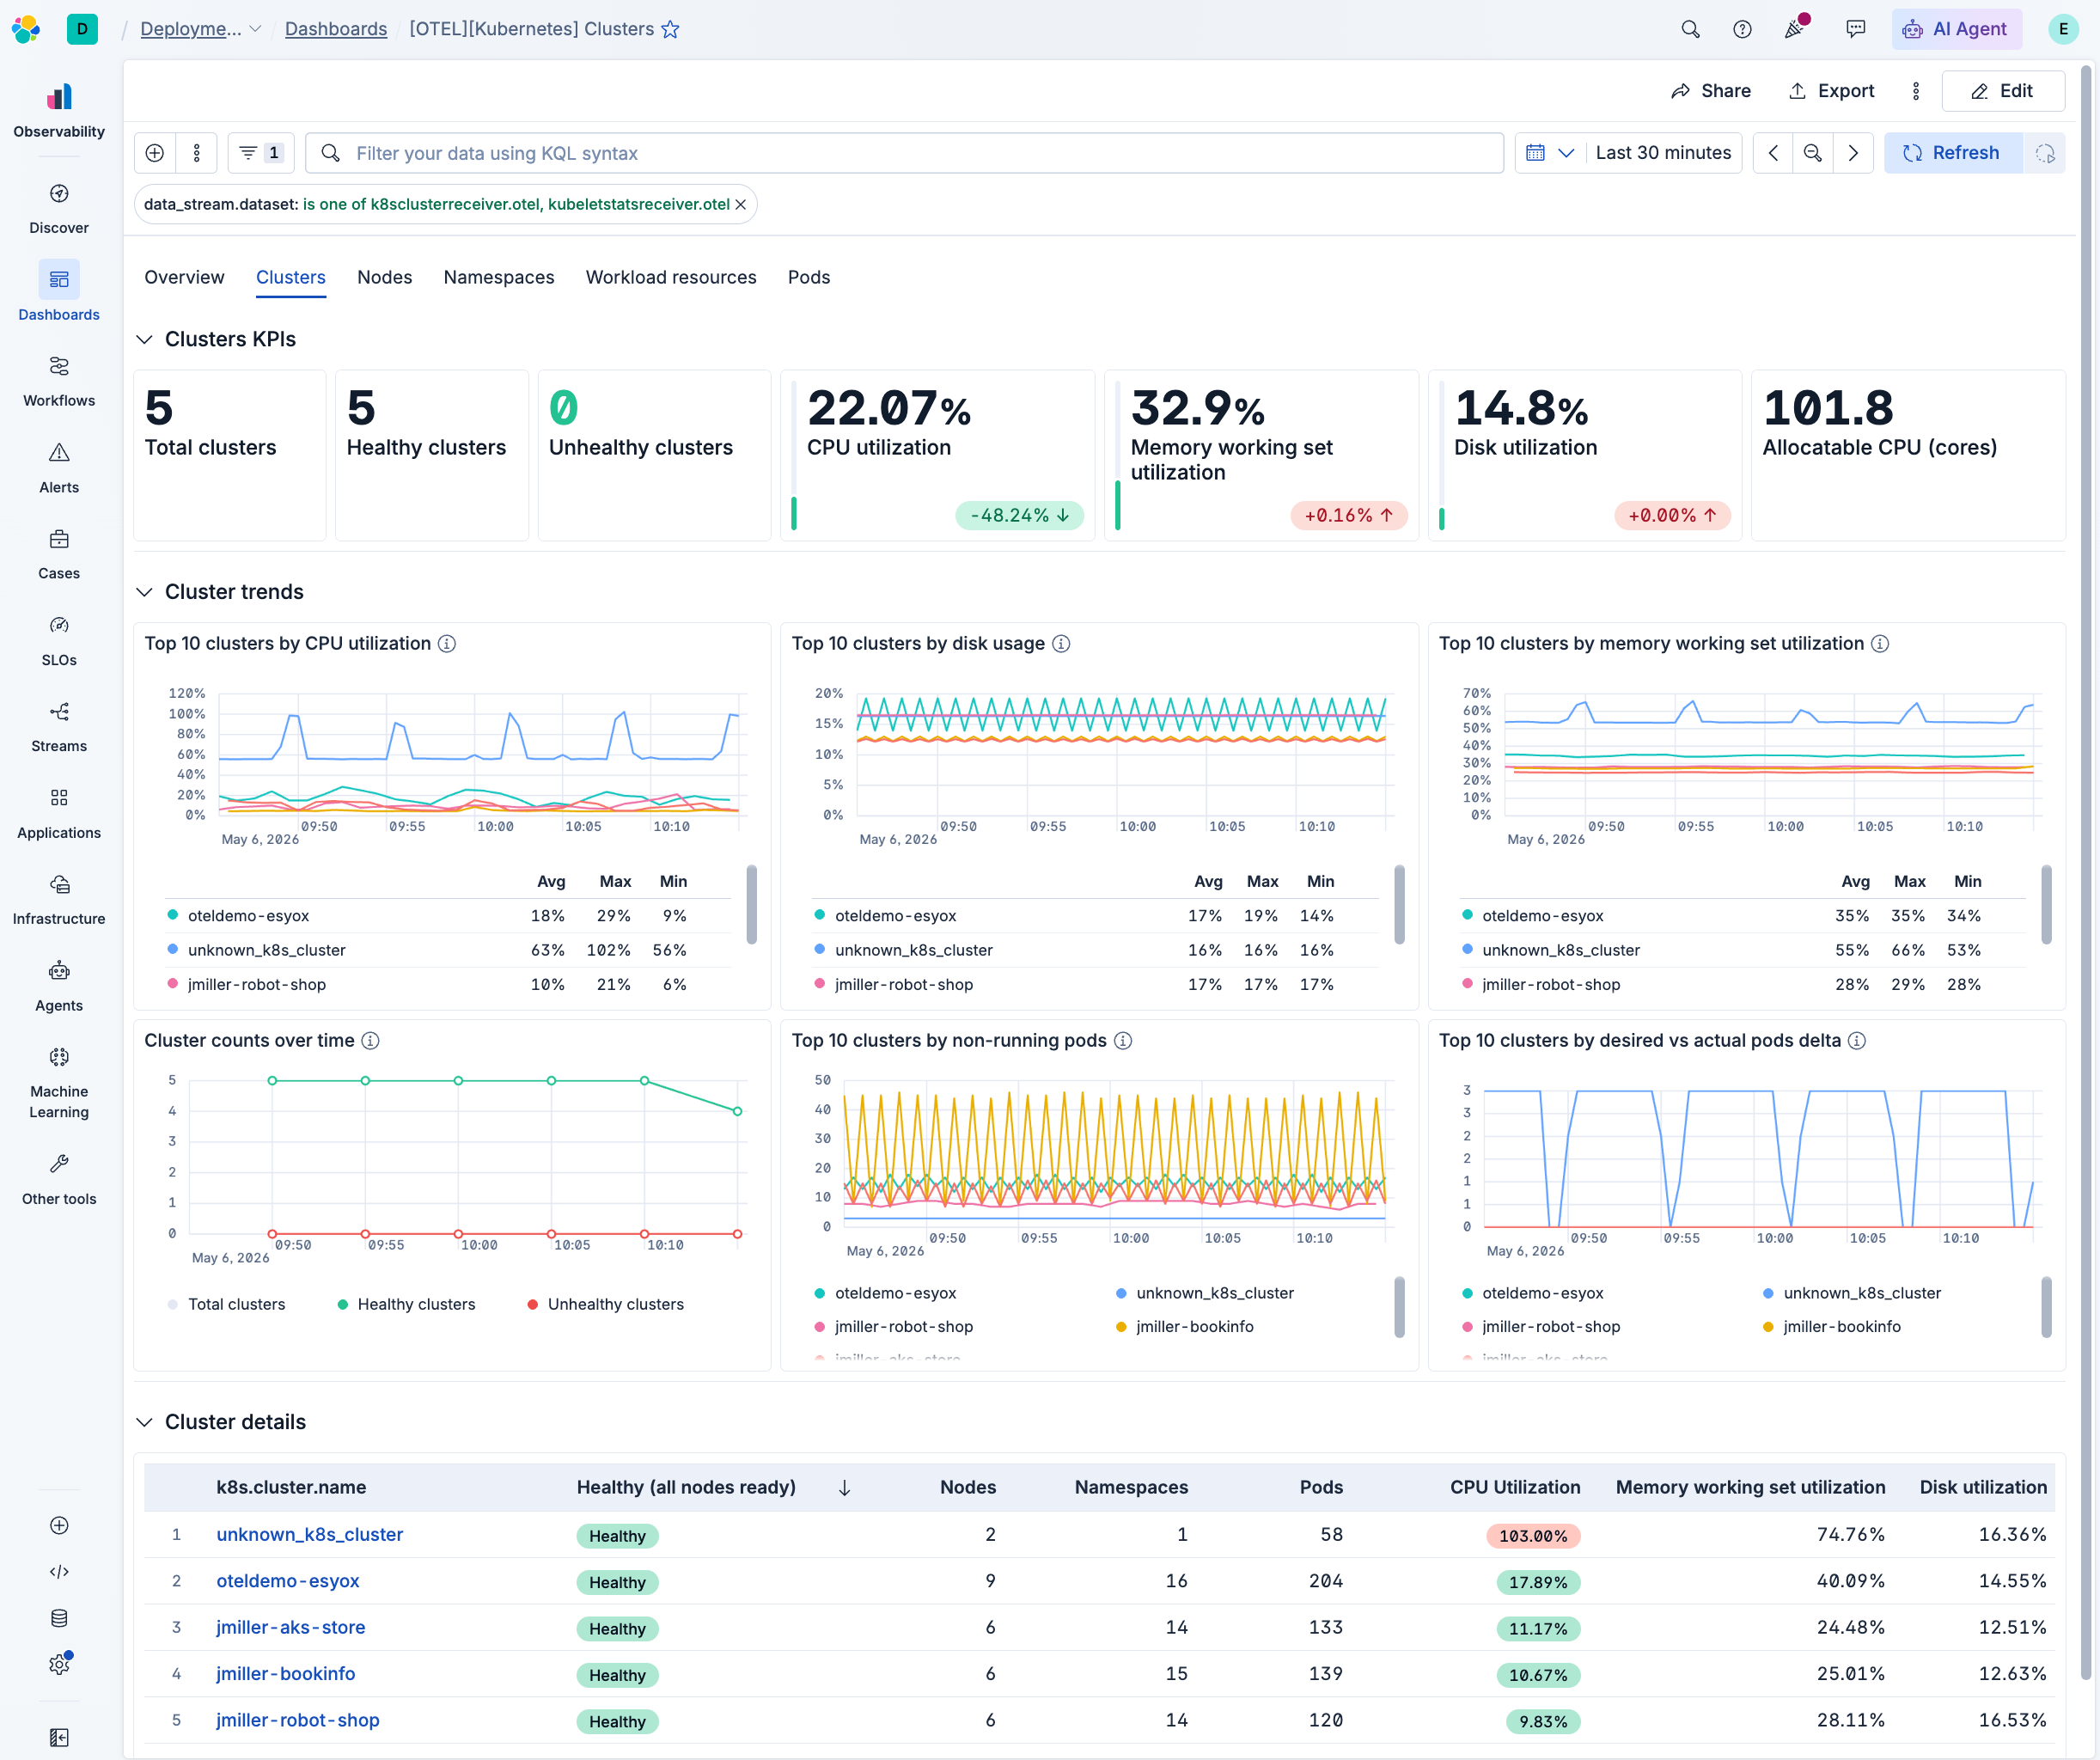
New to dashboards? These hands-on examples walk you through creating your first dashboards using sample data:
- Example: Website logs: Build a dashboard with charts, metrics, and filters to analyze web traffic patterns.
- Example: Time series from eCommerce data: Learn to visualize sales trends and patterns over time using eCommerce data.
Once you understand the basics, explore these common tasks:
Explore and interact
- Inspect and filter a dashboard: Filter data, adjust time ranges, and interact with panels to uncover insights.
Build and customize dashboards
- Ways to build a dashboard: Compare the UI, REST APIs, and AI approaches to find the one that fits how you work.
- Create a dashboard: Start with an empty dashboard and add your content.
- Create dashboards using AI: Generate dashboards from natural language through chat with Elastic Agent Builder.
- Elastic Cloud Serverless projects are autoscaled environments, fully managed by Elastic and available on Elastic Cloud. Availability Preview This functionality is in technical preview and is ready for evaluation. Use with caution in production; it is not recommended for mission-critical workloads. Elastic will work to fix any issues, but features in technical preview are not subject to the support SLA of official GA features. Specific Support terms apply. Serverless interfaces and procedures might differ from classic Elastic Stack deployments. The Elastic Stack includes Elastic's core products such as Elasticsearch, Kibana, Logstash, and Beats. Availability Planned We plan to add this functionality in a future Elastic Stack update. Subject to changes. Unless stated otherwise on the page, this functionality is available when your Elastic Stack is deployed on Elastic Cloud Hosted, Elastic Cloud Enterprise, Elastic Cloud on Kubernetes, and self-managed environments. This documentation corresponds to the latest patch available for each minor version. If you're not using the latest patch, check the release notes for changes. Enhance a dashboard with AI: Let an Elastic Agent Builder agent improve the text, layout, and chart styling of a dashboard you already built.
- Add dashboard controls: Enable interactive filtering with options lists, range sliders, time sliders, and ES|QL variable controls.
- Drilldowns: Open another dashboard, a URL, or Discover from a panel.
- Organize dashboard panels: Arrange panels using collapsible sections, resizing, and positioning.
Manage and share
- Manage dashboards: Browse, search, organize, and track usage of your dashboards.
- Export and share Kibana dashboards: Share with your team using links or embeds, and export as PDF, PNG, CSV, or JSON.
- Duplicate a dashboard: Create customizable copies of existing dashboards.
- Import a dashboard: Bring a dashboard from another space, instance, or deployment into your own.
Some dashboards are created and managed by the system, and are identified as managed in your list of dashboards. This generally happens when you set up an integration to add data. You can't edit managed dashboards directly, but you can duplicate them and edit the duplicates.