Machine learning in Kibana
Elastic Cloud Serverless projects are autoscaled environments, fully managed by Elastic and available on Elastic Cloud. Availability This functionality is generally available and ready for production usage. Serverless interfaces and procedures might differ from classic Elastic Stack deployments. The Elastic Stack includes Elastic's core products such as Elasticsearch, Kibana, Logstash, and Beats. Availability This functionality is generally available and ready for production usage. Unless stated otherwise on the page, this functionality is available when your Elastic Stack is deployed on Elastic Cloud Hosted, Elastic Cloud Enterprise, Elastic Cloud on Kubernetes, and self-managed environments. This documentation corresponds to the latest patch available for each minor version. If you're not using the latest patch, check the release notes for changes.
Serverless
Generally available
Stack
Generally available
As data sets increase in size and complexity, the human effort required to inspect dashboards or maintain rules for spotting infrastructure problems, cyber attacks, or business issues becomes impractical. Elastic machine learning features such as anomaly detection and outlier detection make it easier to notice suspicious activities with minimal human interference.
Kibana includes a free Data Visualizer that helps you understand your data's structure, distribution, and quality before you act on it. If your data is stored in Elasticsearch and contains a time field, the Data Visualizer also helps you identify possible fields for anomaly detection.
Click Zoom in or Zoom out next to the date picker to quickly narrow or widen the time range when exploring your data.
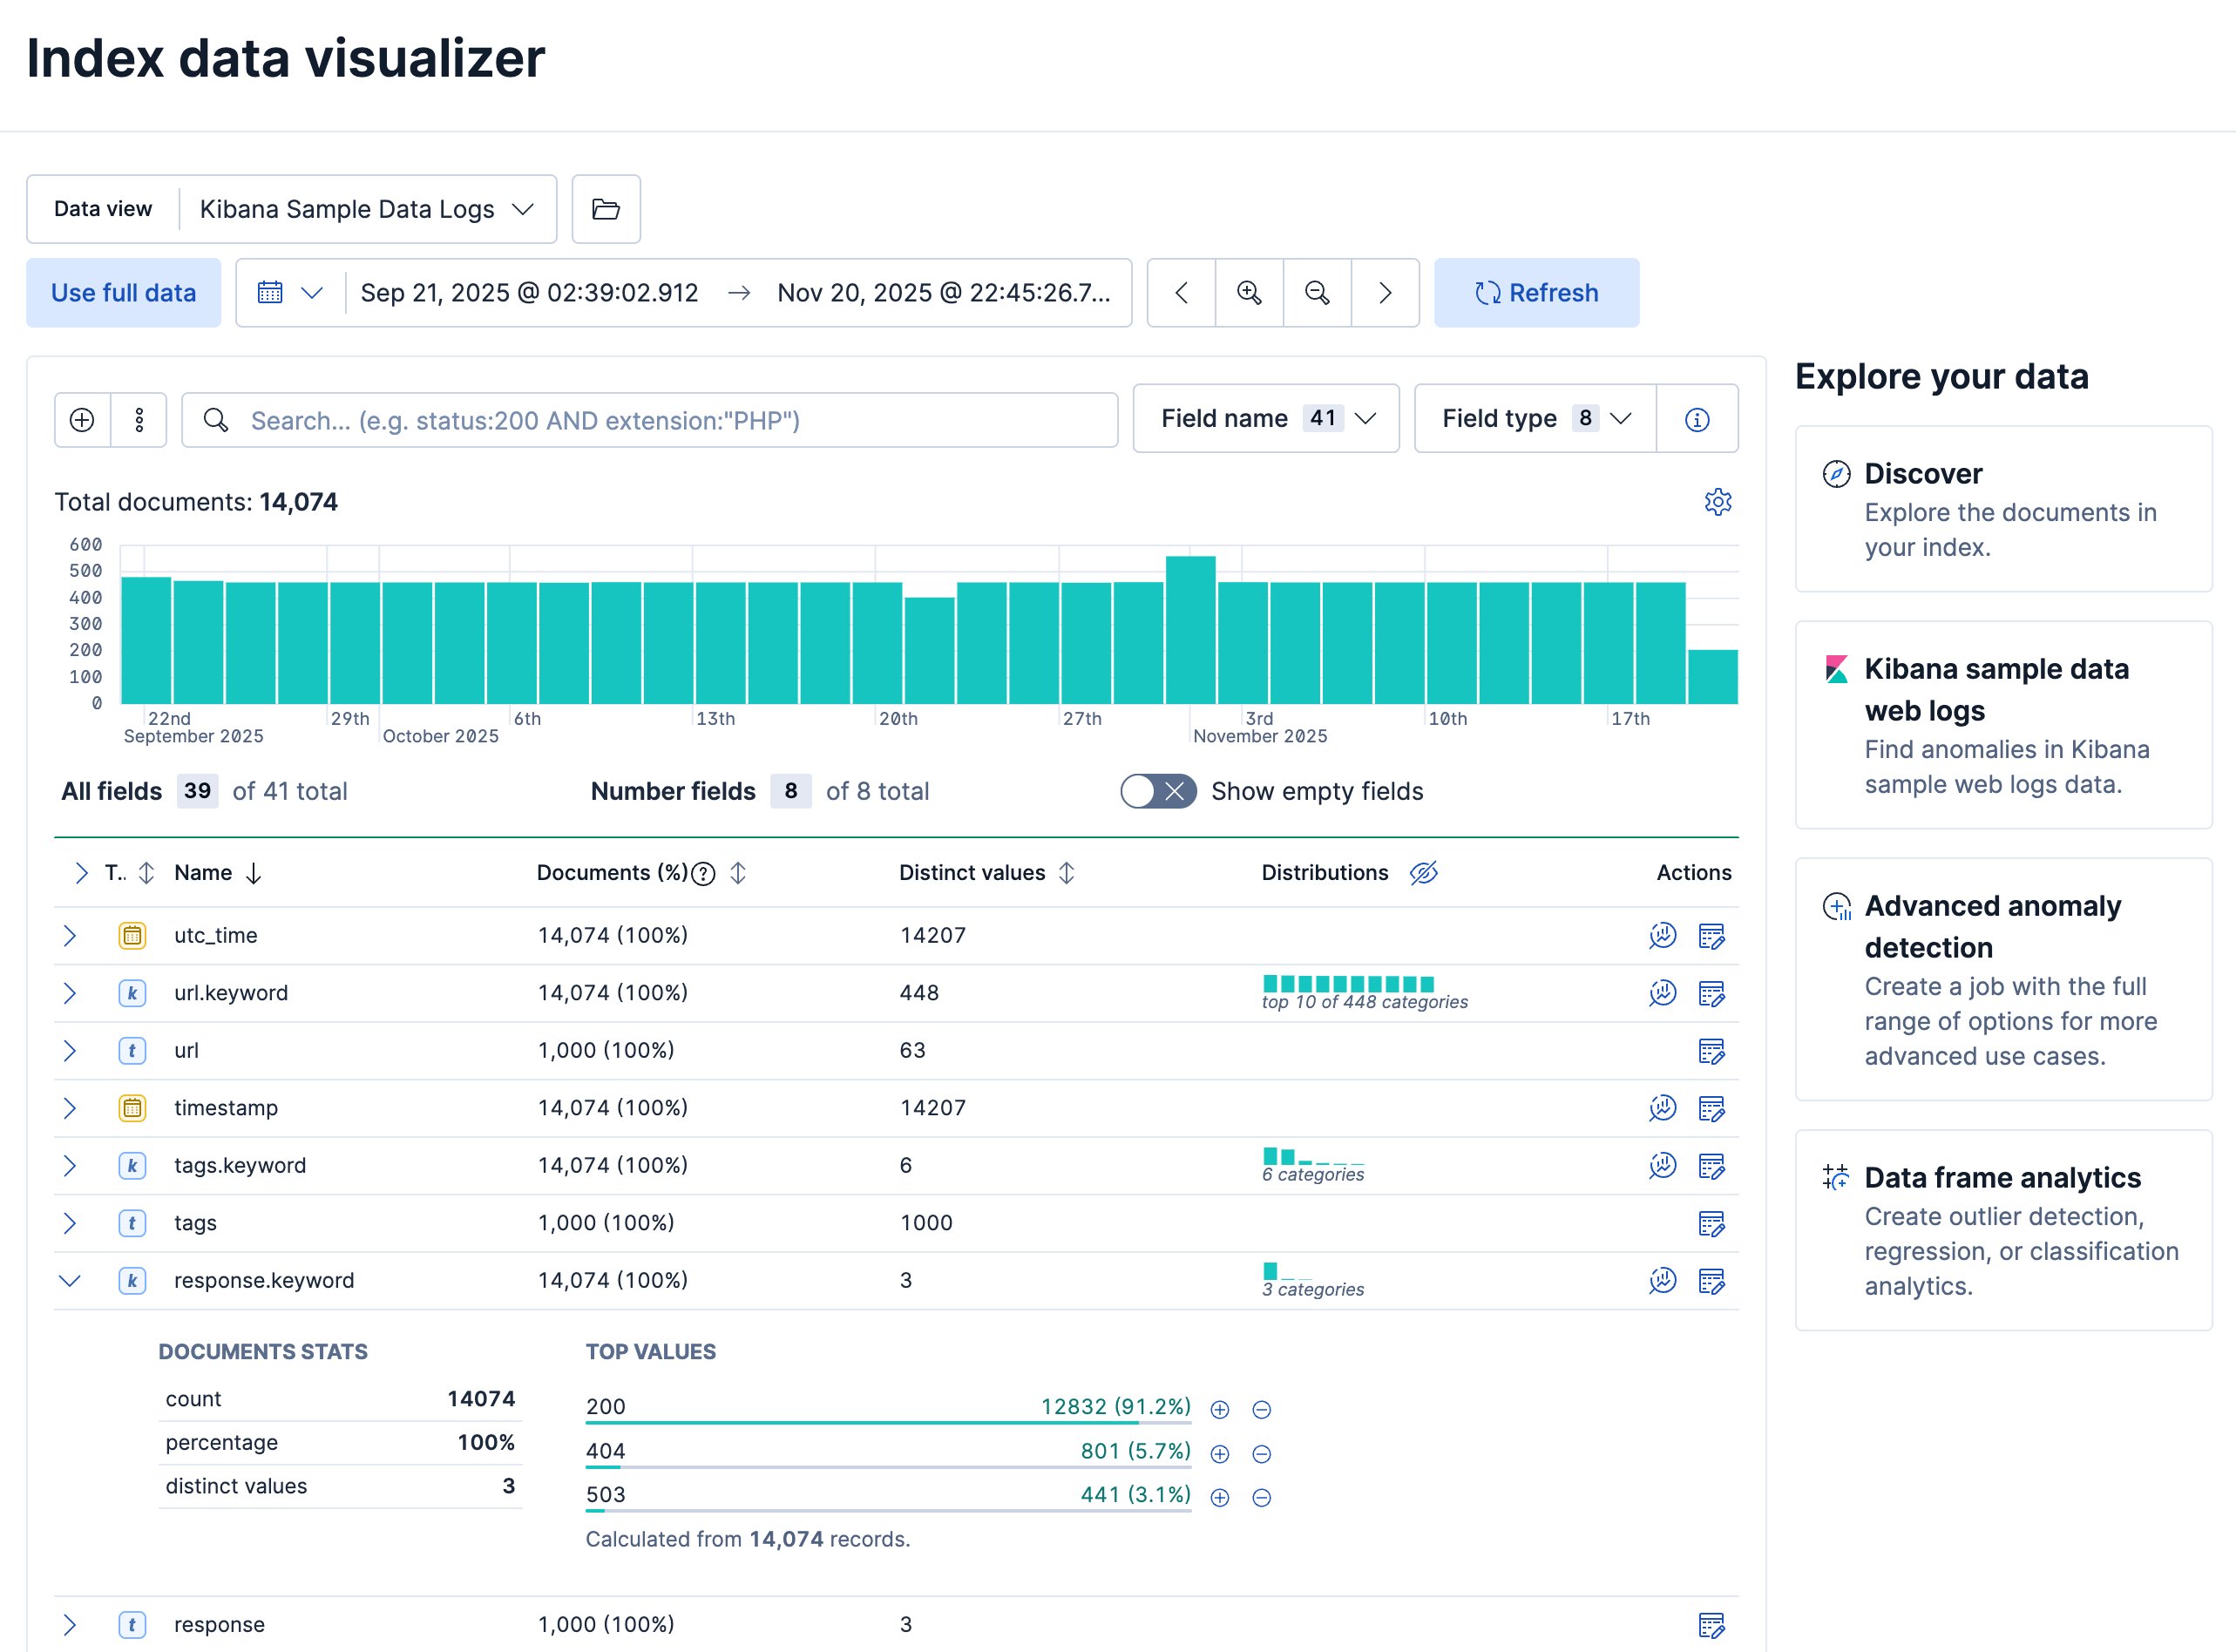
You can upload different file formats for analysis with the Data Visualizer.
File formats supported up to 500 MB:
- CSV
- TSV
- NDJSON
- Log files
File formats supported up to 60 MB:
- Microsoft Office files (Word, Excel, PowerPoint)
- Plain text (TXT)
- Rich text (RTF)
- Open Document Format (ODF)
The Data Visualizer identifies the file format and field mappings, and you can import the data into an Elasticsearch index. To upload files, refer to Upload data files. To change the default file size limit, refer to fileUpload:maxFileSize in Advanced Settings.
If Elastic Stack security features are enabled, users must have the necessary privileges to use machine learning features. Refer to Set up machine learning features.
There are limitations in machine learning features that affect Kibana. For more information, refer to Machine learning.
Elastic Cloud Serverless projects are autoscaled environments, fully managed by Elastic and available on Elastic Cloud. Availability This functionality is generally available and ready for production usage. Serverless interfaces and procedures might differ from classic Elastic Stack deployments. The Elastic Stack includes Elastic's core products such as Elasticsearch, Kibana, Logstash, and Beats. Availability This functionality is generally available and ready for production usage. This functionality is in technical preview and is ready for evaluation. Use with caution in production; it is not recommended for mission-critical workloads. Elastic will work to fix any issues, but features in technical preview are not subject to the support SLA of official GA features. Specific Support terms apply. Unless stated otherwise on the page, this functionality is available when your Elastic Stack is deployed on Elastic Cloud Hosted, Elastic Cloud Enterprise, Elastic Cloud on Kubernetes, and self-managed environments. This documentation corresponds to the latest patch available for each minor version. If you're not using the latest patch, check the release notes for changes.
Serverless
Generally available
Stack
GA
9.4+
…
Generally available since 9.4
Preview from 9.0 to 9.3
You can find the Data drift view in Machine Learning → Data Visualizer in Kibana or by using the global search field. The Data drift view shows you the differences in each field for two different time ranges in a given data view. The view helps you to visualize the changes in your data over time and enables you to understand its behavior better.
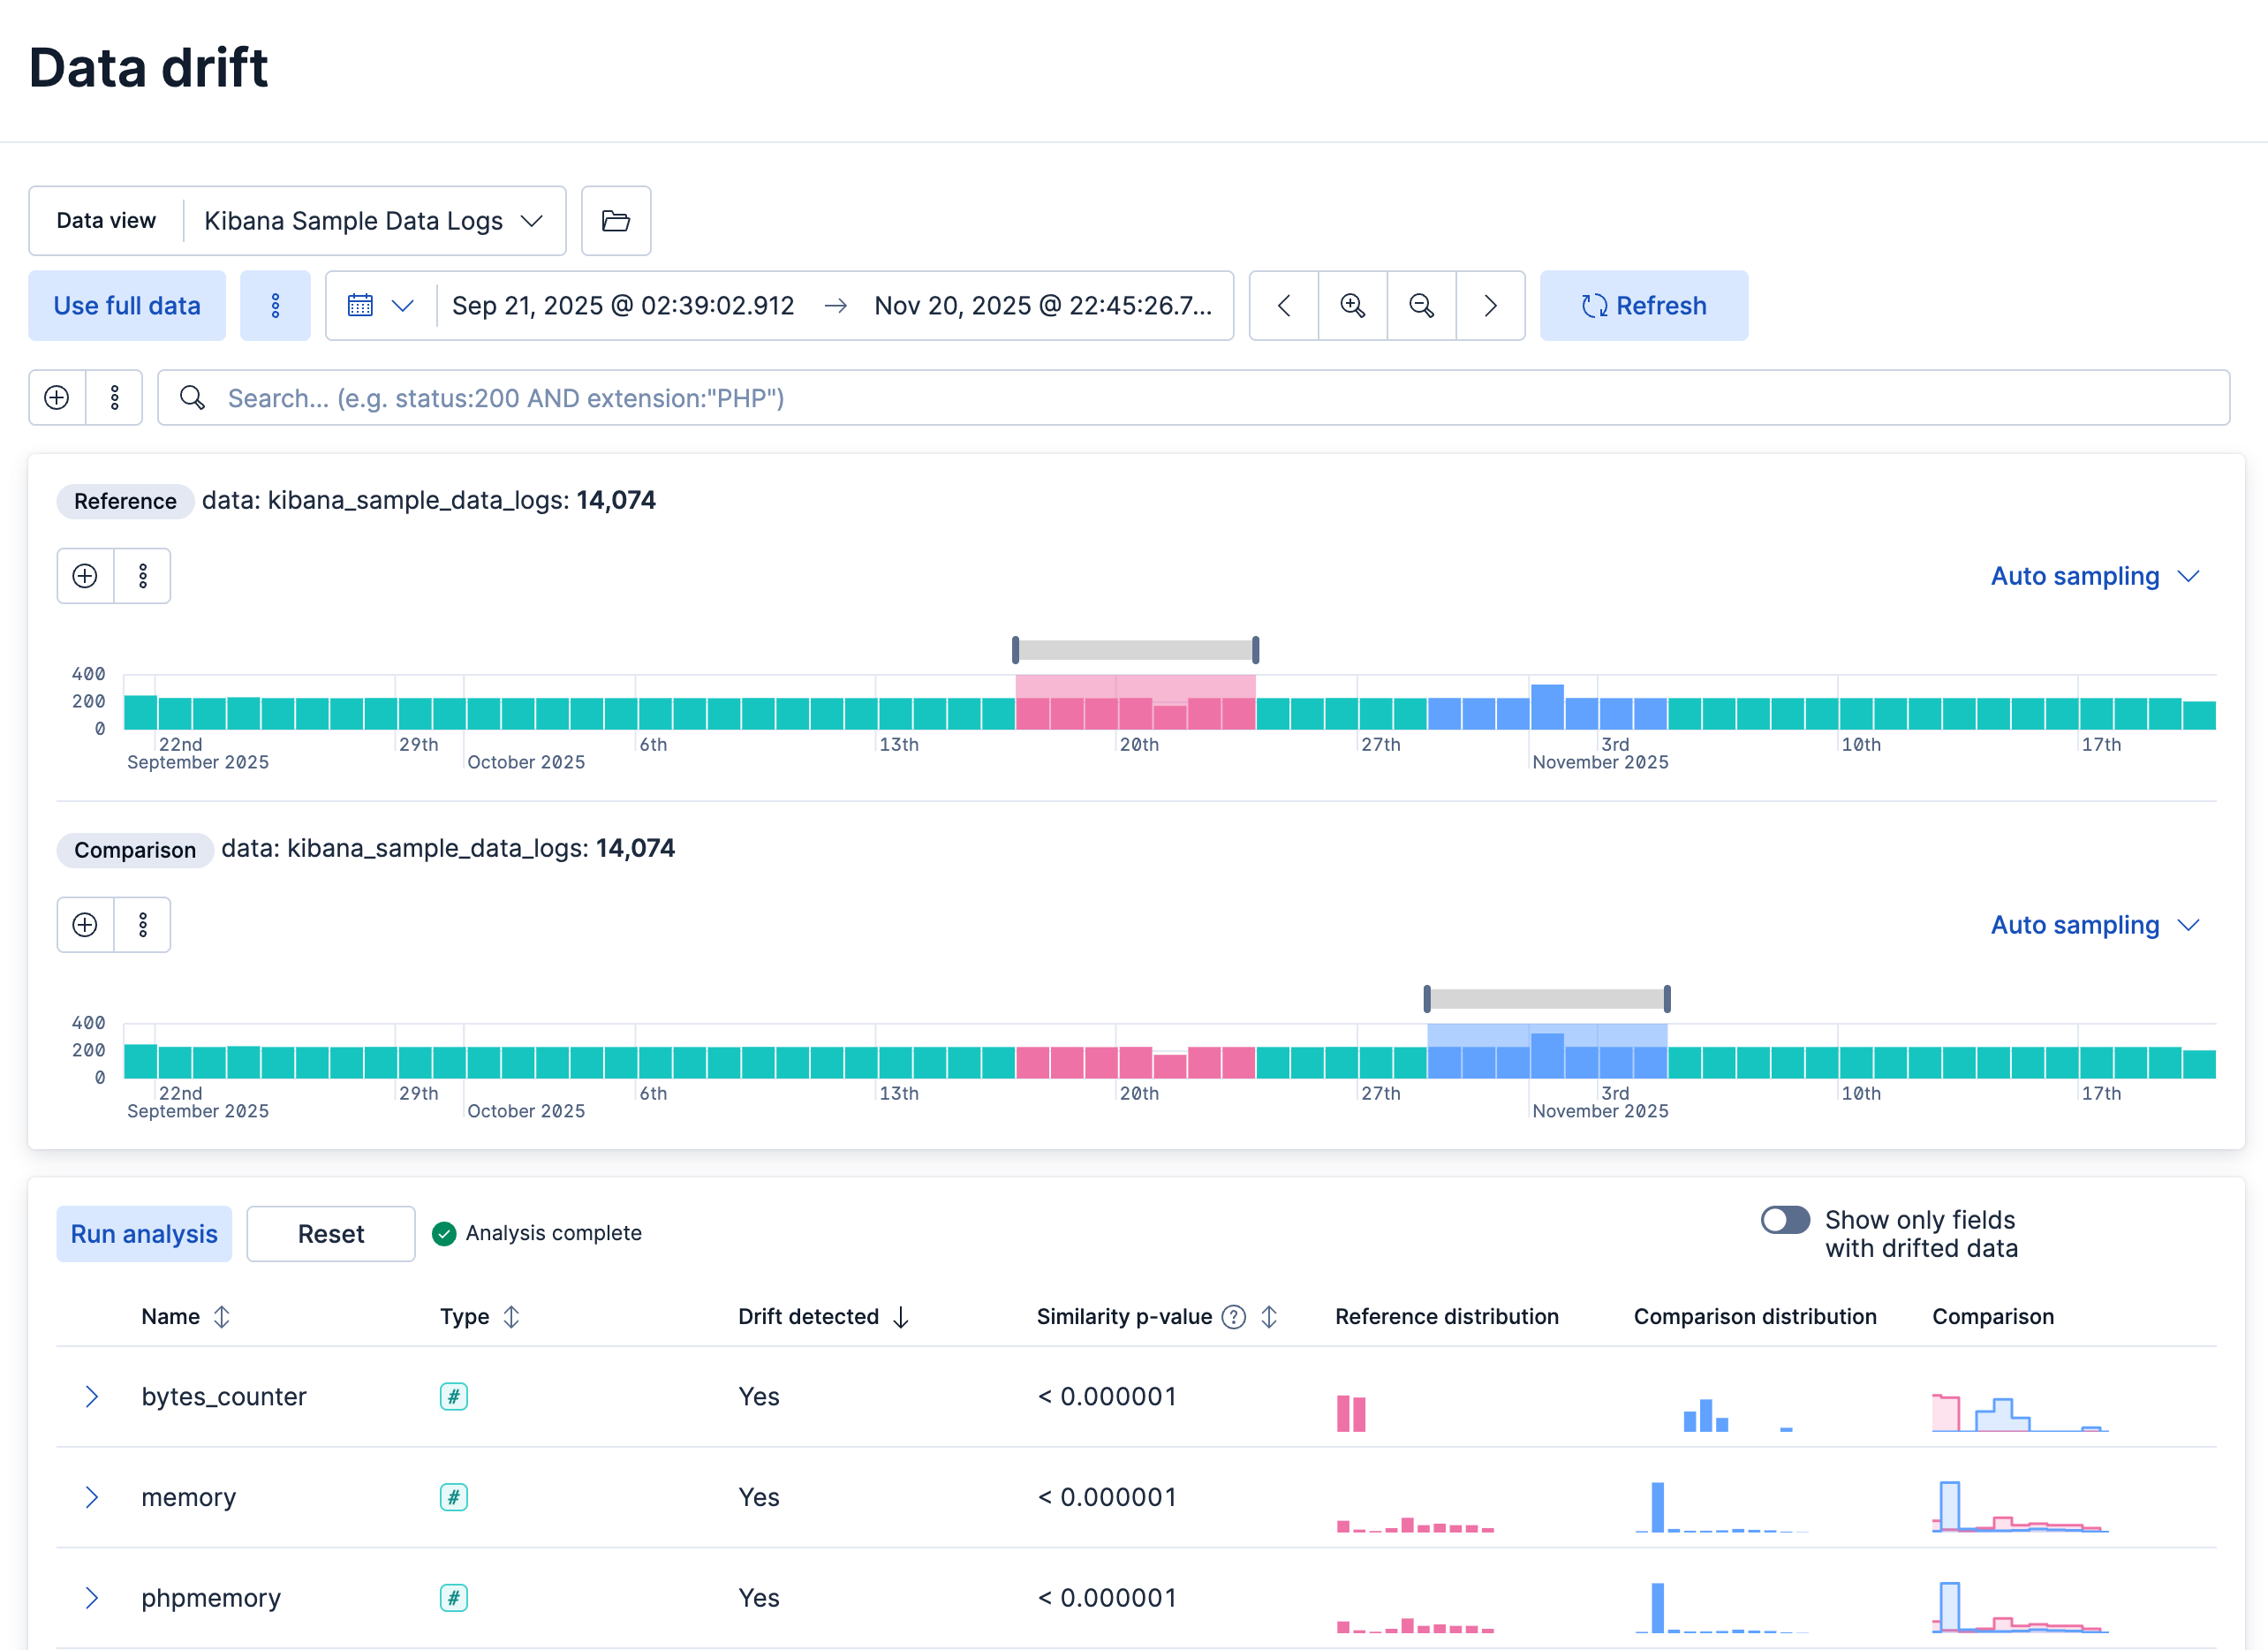
You select a data view to analyze, along with separate time ranges for the reference and comparison data in the histogram chart, adjusting each range by moving its brush. Run analysis then compares the reference and comparison periods.
You can decide whether you want to view all the fields in the data view or only the ones that contain drifted data. The analysis results table displays the fields, their types, if drift is detected, the p-value that indicates how significant the detected change is, the reference and comparison distribution, and the comparison chart. To expand the results for a particular field, select its row's arrow icon.