Inspect uptime duration anomalies
Elastic Cloud Serverless projects are autoscaled environments, fully managed by Elastic and available on Elastic Cloud. Availability This functionality is not available in Elastic Cloud Serverless. The Elastic Stack includes Elastic's core products such as Elasticsearch, Kibana, Logstash, and Beats. Availability This functionality is deprecated. You can still use it, but it'll be removed in a future Elastic Stack update. This documentation corresponds to the latest patch available for each minor version. If you're not using the latest patch, check the release notes for changes.
Serverless
Unavailable
Unavailable
Stack
Deprecated
8.15+
Deprecated since 8.15
Use Synthetic monitoring instead of the Uptime app.
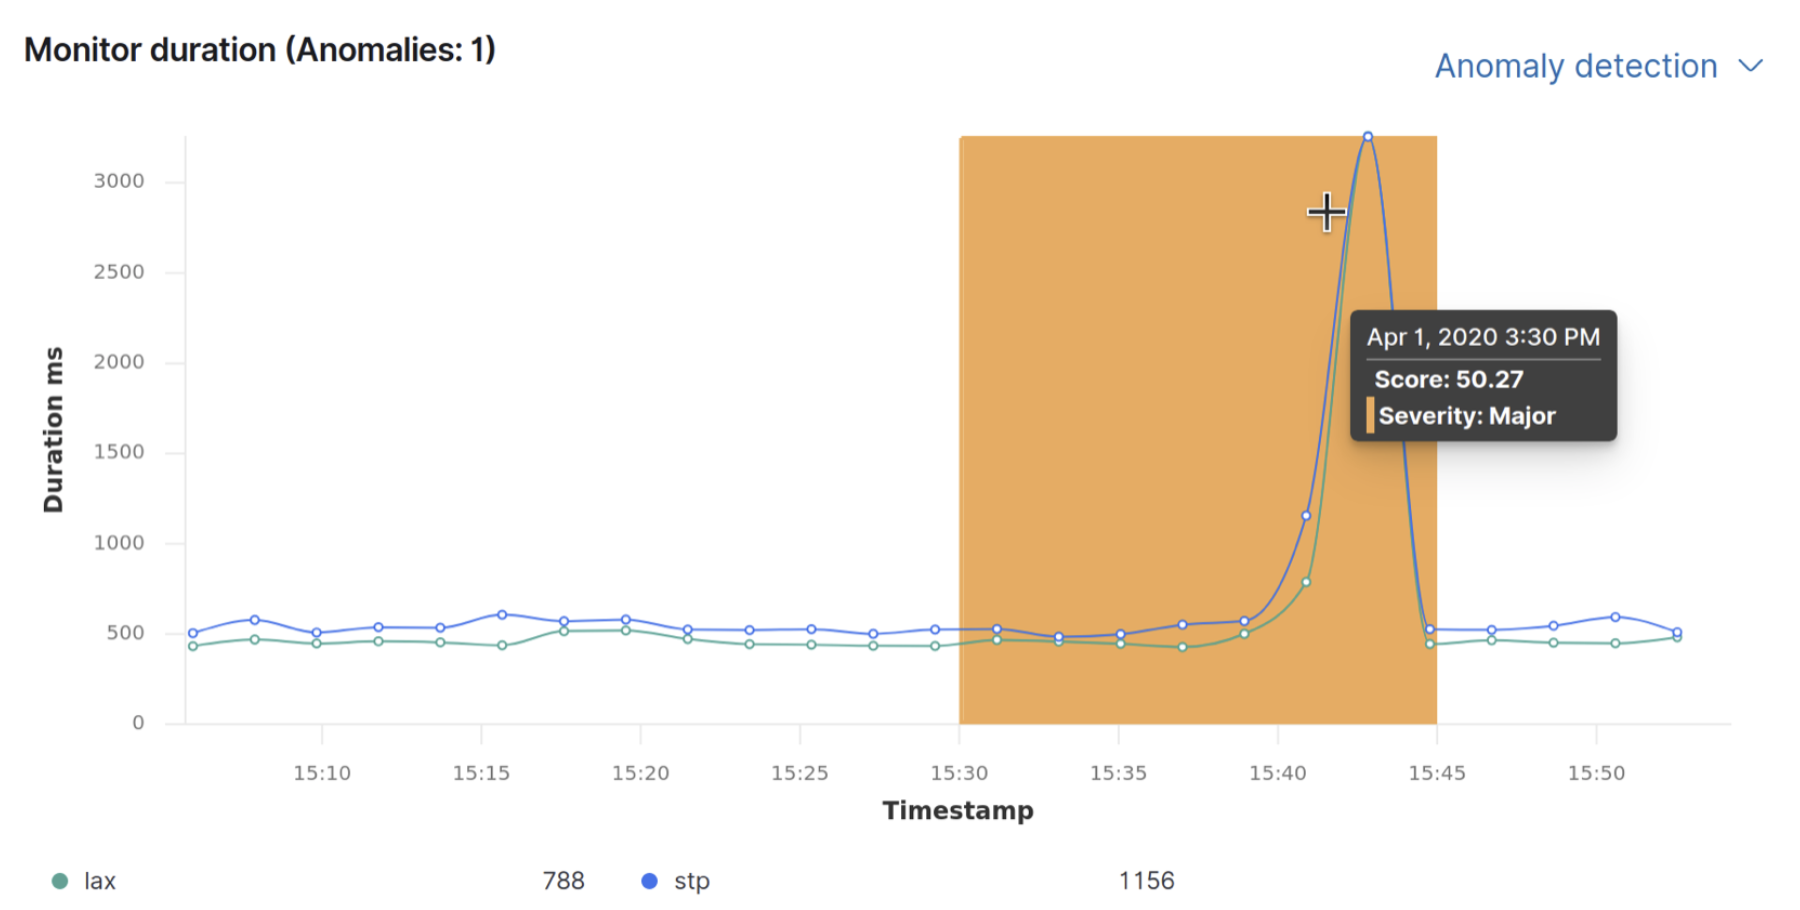
Each monitor location is modeled, and when a monitor runs for an unusual amount of time, at a particular time, an anomaly is recorded and highlighted on the Monitor duration chart.
Create a machine learning job to detect anomalous monitor duration rates automatically.
To access this page, go to Observability > Uptime > Monitors, and then click a monitor to view its the details.
In the Monitor duration panel, click Enable anomaly detection.
NoteIf anomaly detection is already enabled, click Anomaly detection and select to view duration anomalies directly in the Machine Learning app, enable an anomaly rule, or disable the anomaly detection.
You are prompted to create a response duration anomaly rule for the machine learning job which will carry out the analysis, and you can configure which severity level to create the rule for.
When an anomaly is detected, the duration is displayed on the Monitor duration chart, along with the duration times. The colors represent the criticality of the anomaly: red (critical) and yellow (minor).