Scripting browser monitors
Elastic Cloud Serverless projects are autoscaled environments, fully managed by Elastic and available on Elastic Cloud. Availability This functionality is generally available and ready for production usage. Serverless interfaces and procedures might differ from classic Elastic Stack deployments. The Elastic Stack includes Elastic's core products such as Elasticsearch, Kibana, Logstash, and Beats. Availability This functionality is generally available and ready for production usage. Unless stated otherwise on the page, this functionality is available when your Elastic Stack is deployed on Elastic Cloud Hosted, Elastic Cloud Enterprise, Elastic Cloud on Kubernetes, and self-managed environments. This documentation corresponds to the latest patch available for each minor version. If you're not using the latest patch, check the release notes for changes.
Serverless
Generally available
Stack
Generally available
Browser monitors are a type of synthetic monitor. Synthetic monitoring extends traditional end-to-end testing techniques because it allows your tests to run continuously on the cloud. With synthetic monitoring, you can assert that your application continues to work after a deployment by reusing the same journeys that you used to validate the software on your machine.
You can use synthetic monitors to detect bugs caused by invalid states you couldn’t predict and didn’t write tests for. Synthetic monitors can also help you catch bugs in features that don’t get much traffic by allowing you to periodically simulate users' actions.
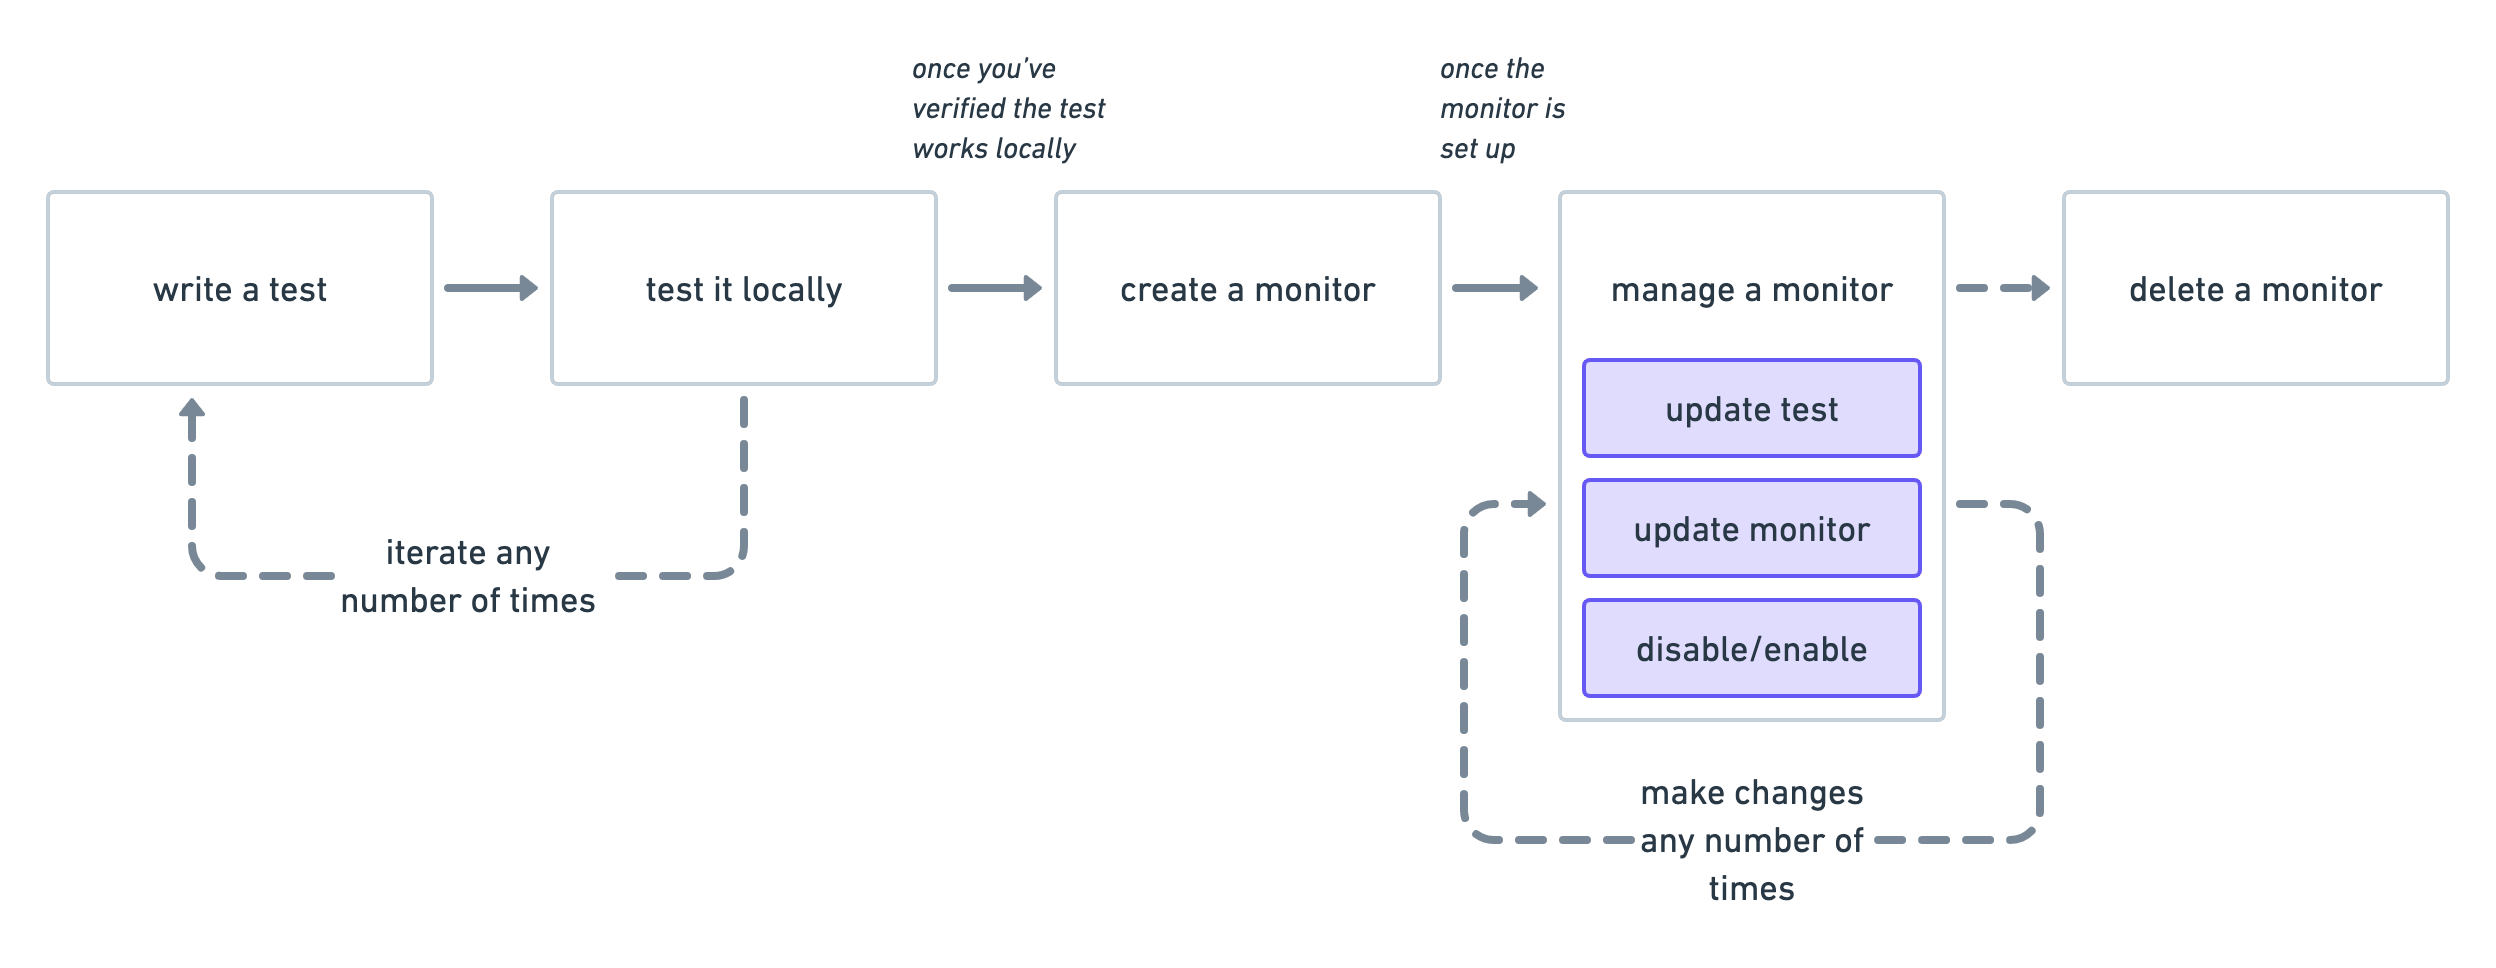
Start by learning the basics of synthetic monitoring, including how to:
- Write a synthetic test
- Test locally
- Configure individual browser monitors
- Work with params and secrets
- Use the Synthetics Recorder