Managing dashboards
Elastic Cloud Serverless projects are autoscaled environments, fully managed by Elastic and available on Elastic Cloud. Availability This functionality is generally available and ready for production usage. Serverless interfaces and procedures might differ from classic Elastic Stack deployments. The Elastic Stack includes Elastic's core products such as Elasticsearch, Kibana, Logstash, and Beats. Availability This functionality is generally available and ready for production usage. Unless stated otherwise on the page, this functionality is available when your Elastic Stack is deployed on Elastic Cloud Hosted, Elastic Cloud Enterprise, Elastic Cloud on Kubernetes, and self-managed environments. This documentation corresponds to the latest patch available for each minor version. If you're not using the latest patch, check the release notes for changes.
Serverless
Generally available
Stack
Generally available
Manage your collection of dashboards in Kibana using search, filtering, and organization features that help you quickly find and track the dashboards you need. Whether you're working with a few dashboards or hundreds, these management tools help you stay organized and monitor dashboard usage across your team.
On this page, find and organize your dashboards:
- Browse dashboards: Search, filter, and sort to quickly find the dashboards you need in a large collection.
- Browse saved visualizations and annotation groups: Manage the visualizations saved in the library that you can reuse across multiple dashboards.
- Keep track of your favorite dashboards: Flag the dashboards you use often so you can access them faster.
- View dashboard usage: Check how much a dashboard is viewed.
To move dashboards between environments or manage them as code, refer to:
- Export and share Kibana dashboards: Share with your team using links or embeds, and export as PDF, PNG, CSV, or JSON.
- Import a dashboard: Bring a dashboard from another space, instance, deployment, or project into your own.
- Manage dashboards as code: Version-control dashboards and deploy them across spaces, clusters, and stages.
When looking for specific dashboards to open or share, several actions are available to you to help you find them quicker.
Search by name, description, or tag
On your list of Dashboards, use the search field to look for specific terms. These terms will be highlighted in real time in your dashboard list to help you locate what’s relevant to you.
Filter by tag
When creating or editing dashboards, you can assign them tags that allow you to retrieve them faster in the future.
On your dashboard list, you have an option that lets you filter dashboards in or out based on their tags.
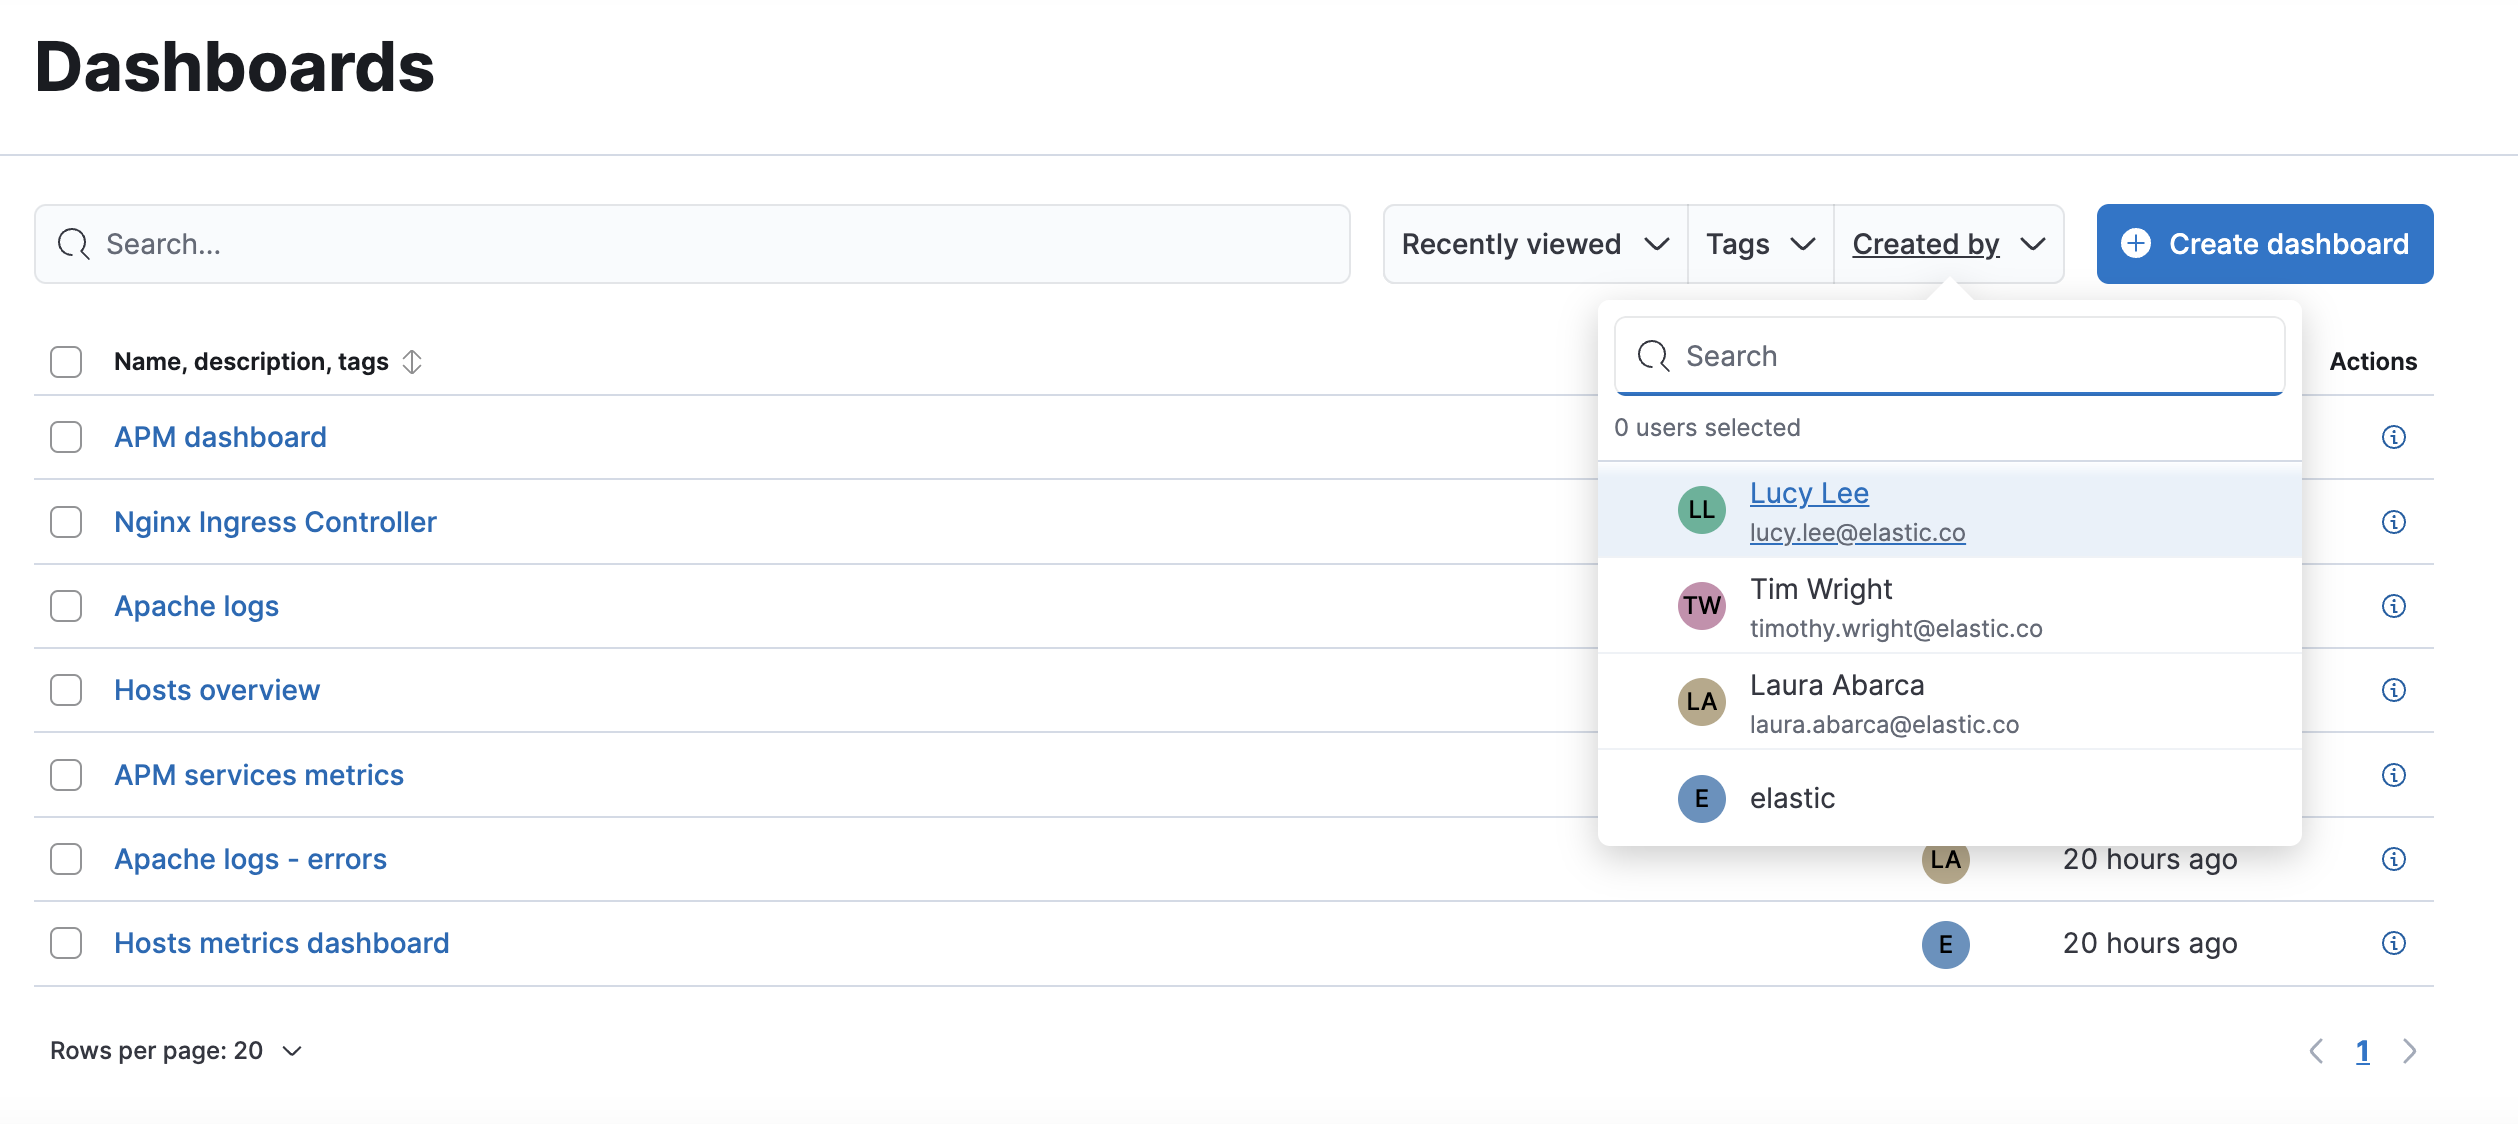
Filter by creator
The user who created or imported a dashboard is identified as the dashboard’s creator. This information is visible right from the dashboard list, and you can filter that list by creator.
Similarly, managed dashboards created by integrations are identified as created by Elastic.
The creator information is only available for dashboards created on or after version 8.14. For dashboards from previous versions, the creator is empty.
Sort by name or last update date
By default, your most recently viewed dashboards are displayed first. You can instead sort the dashboard list based on their name or their last update date.
Reopen a recently viewed dashboard
Elastic Cloud Serverless projects are autoscaled environments, fully managed by Elastic and available on Elastic Cloud. Availability Generally available This functionality is generally available and ready for production usage. Serverless interfaces and procedures might differ from classic Elastic Stack deployments. The Elastic Stack includes Elastic's core products such as Elasticsearch, Kibana, Logstash, and Beats. Availability Planned We plan to add this functionality in a future Elastic Stack update. Subject to changes. Unless stated otherwise on the page, this functionality is available when your Elastic Stack is deployed on Elastic Cloud Hosted, Elastic Cloud Enterprise, Elastic Cloud on Kubernetes, and self-managed environments. This documentation corresponds to the latest patch available for each minor version. If you're not using the latest patch, check the release notes for changes. In the Elasticsearch and Observability solution views and project types, and in Elasticsearch Vector Database projects, you can return to a dashboard you opened or saved earlier without going through the dashboard list. Hover over Dashboards in the navigation menu or move keyboard focus to it, then select the dashboard from Recently viewed. This list shows your five latest dashboards first. Select Show more to show older ones, up to 20 in total.
To browse your saved visualizations and annotation groups, open the Visualize library. Where you open it depends on your deployment and version.
- Elastic Cloud Serverless projects are autoscaled environments, fully managed by Elastic and available on Elastic Cloud. Availability Generally available This functionality is generally available and ready for production usage. Serverless interfaces and procedures might differ from classic Elastic Stack deployments. The Elastic Stack includes Elastic's core products such as Elasticsearch, Kibana, Logstash, and Beats. Availability Generally available since 9.4 This functionality is generally available and ready for production usage. Unless stated otherwise on the page, this functionality is available when your Elastic Stack is deployed on Elastic Cloud Hosted, Elastic Cloud Enterprise, Elastic Cloud on Kubernetes, and self-managed environments. This documentation corresponds to the latest patch available for each minor version. If you're not using the latest patch, check the release notes for changes. On the Dashboards page, select the Visualizations tab for visualizations or the Annotation groups tab for annotation groups. In the Elastic Stack Classic view, you can also select Visualize library in the navigation menu.
- The Elastic Stack includes Elastic's core products such as Elasticsearch, Kibana, Logstash, and Beats. Availability Generally available from 9.0 to 9.3 This functionality is generally available and ready for production usage. Unless stated otherwise on the page, this functionality is available when your Elastic Stack is deployed on Elastic Cloud Hosted, Elastic Cloud Enterprise, Elastic Cloud on Kubernetes, and self-managed environments. This documentation corresponds to the latest patch available for each minor version. If you're not using the latest patch, check the release notes for changes. Select Visualize library in the navigation menu, or search for it in the global search field. Then select the Visualizations or Annotation groups tab.
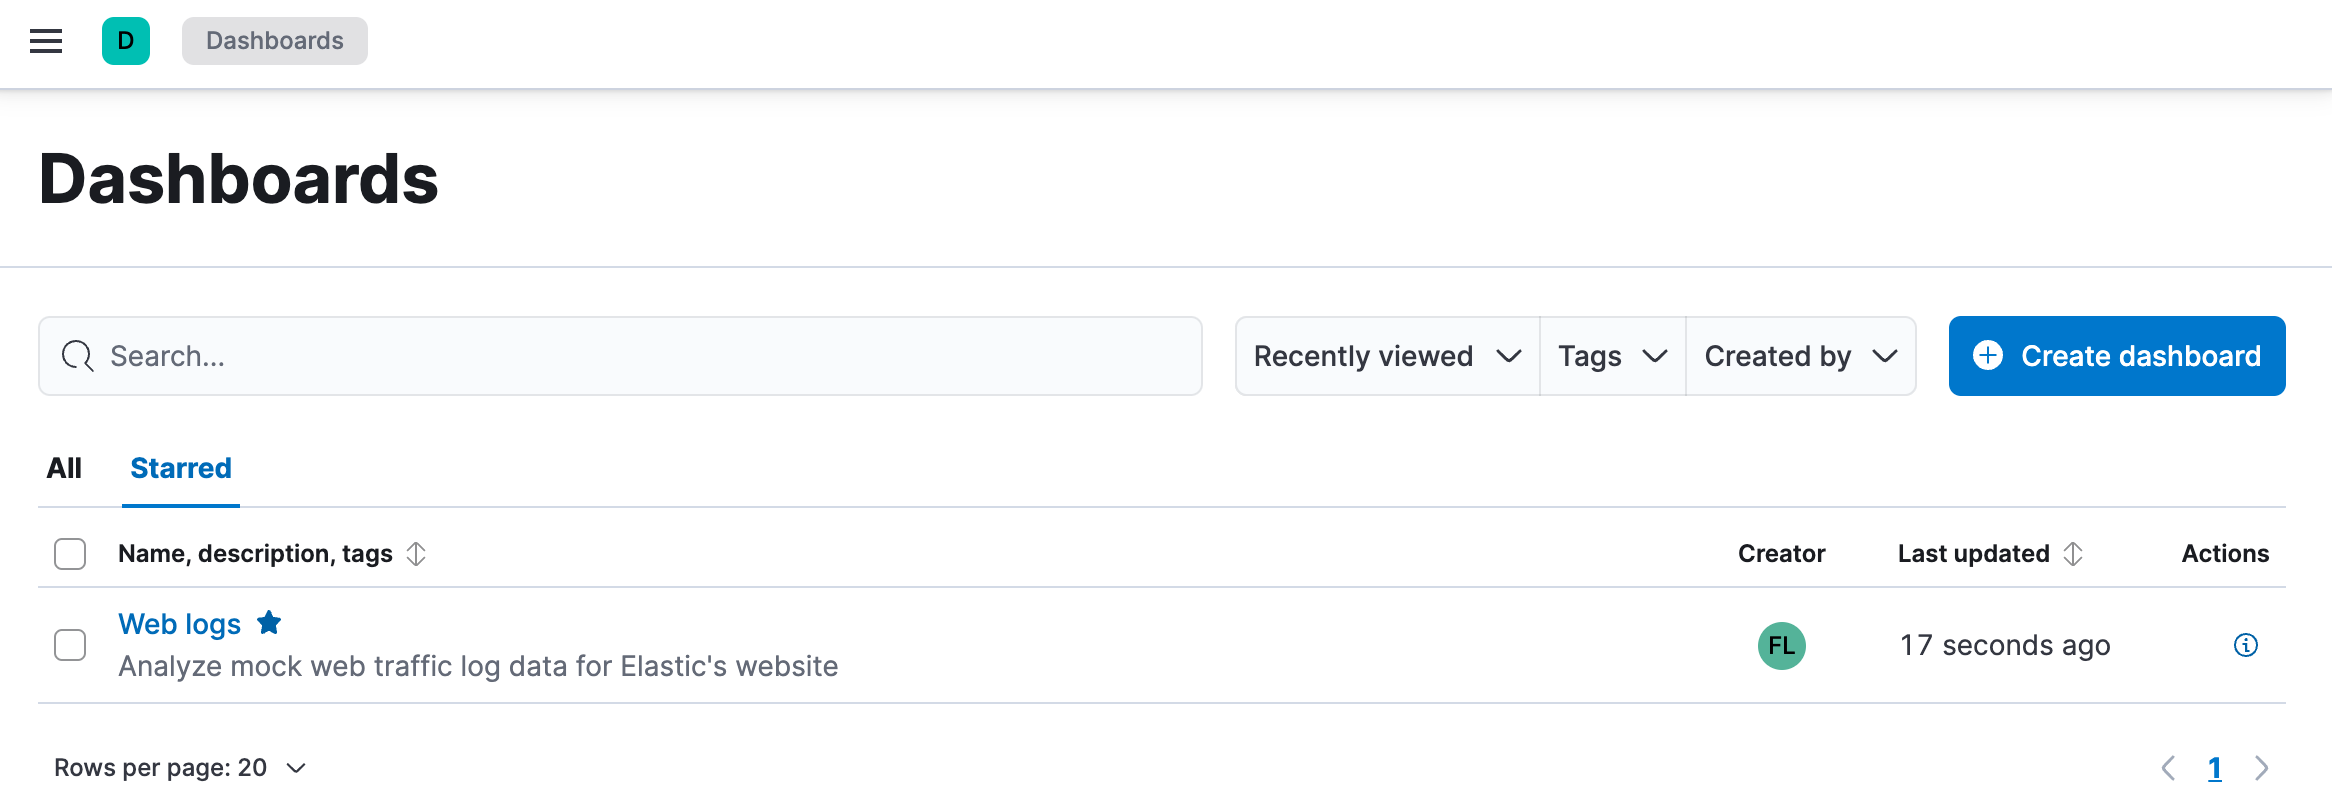
You can mark any dashboards as favorite, using the ✩ star icon from the Dashboards page or from the dashboard itself.
All dashboards marked as favorite are gathered in the Starred tab so you can find them quickly.
The list of starred dashboards is personal. Dashboards marked as favorite by other users only appear for those users.
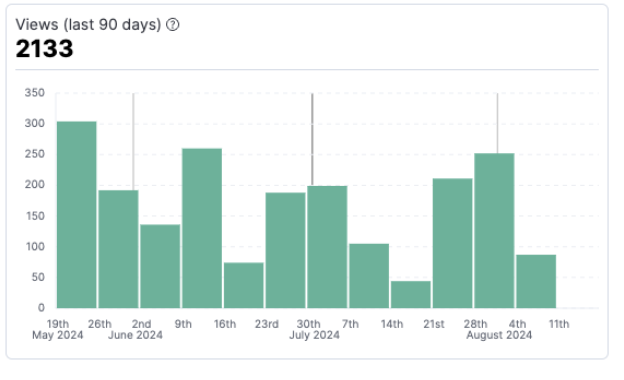
You can check how much a dashboard is being used by clicking its View details icon in your list of dashboards.

These details include a graph showing the total number of views during the last 90 days.
The Elastic Stack includes Elastic's core products such as Elasticsearch, Kibana, Logstash, and Beats. Availability Preview since 9.5 This functionality is in technical preview and is ready for evaluation. Use with caution in production; it is not recommended for mission-critical workloads. Elastic will work to fix any issues, but features in technical preview are not subject to the support SLA of official GA features. Specific Support terms apply. Unless stated otherwise on the page, this functionality is available when your Elastic Stack is deployed on Elastic Cloud Hosted, Elastic Cloud Enterprise, Elastic Cloud on Kubernetes, and self-managed environments. This documentation corresponds to the latest patch available for each minor version. If you're not using the latest patch, check the release notes for changes. For per-user records of dashboard creation, updates, deletion, views, and refreshes, configure Kibana user activity logging.