Kubernetes dashboard
Elastic Cloud Serverless projects are autoscaled environments, fully managed by Elastic and available on Elastic Cloud. Availability This functionality is in beta and is not ready for production usage. For beta features, the design and code is less mature than official GA features and is being provided as-is with no warranties. Beta features are not subject to the support SLA of official GA features. Specific Support terms apply. The Elastic Stack includes Elastic's core products such as Elasticsearch, Kibana, Logstash, and Beats. Availability This functionality is in beta and is not ready for production usage. For beta features, the design and code is less mature than official GA features and is being provided as-is with no warranties. Beta features are not subject to the support SLA of official GA features. Specific Support terms apply. Unless stated otherwise on the page, this functionality is available when your Elastic Stack is deployed on Elastic Cloud Hosted, Elastic Cloud Enterprise, Elastic Cloud on Kubernetes, and self-managed environments. This documentation corresponds to the latest patch available for each minor version. If you're not using the latest patch, check the release notes for changes.
Serverless Security
Beta
Beta
Stack
Beta
9.3+
Beta since 9.3
The Kubernetes dashboard provides insight into Linux process data from your Kubernetes clusters. It shows sessions in detail and in the context of your monitored infrastructure.
- Kubernetes node operating systems must have Linux kernels 5.10.16 or higher.
- This feature is currently available on GKE and EKS using Linux hosts and Kubernetes versions that match these specifications.
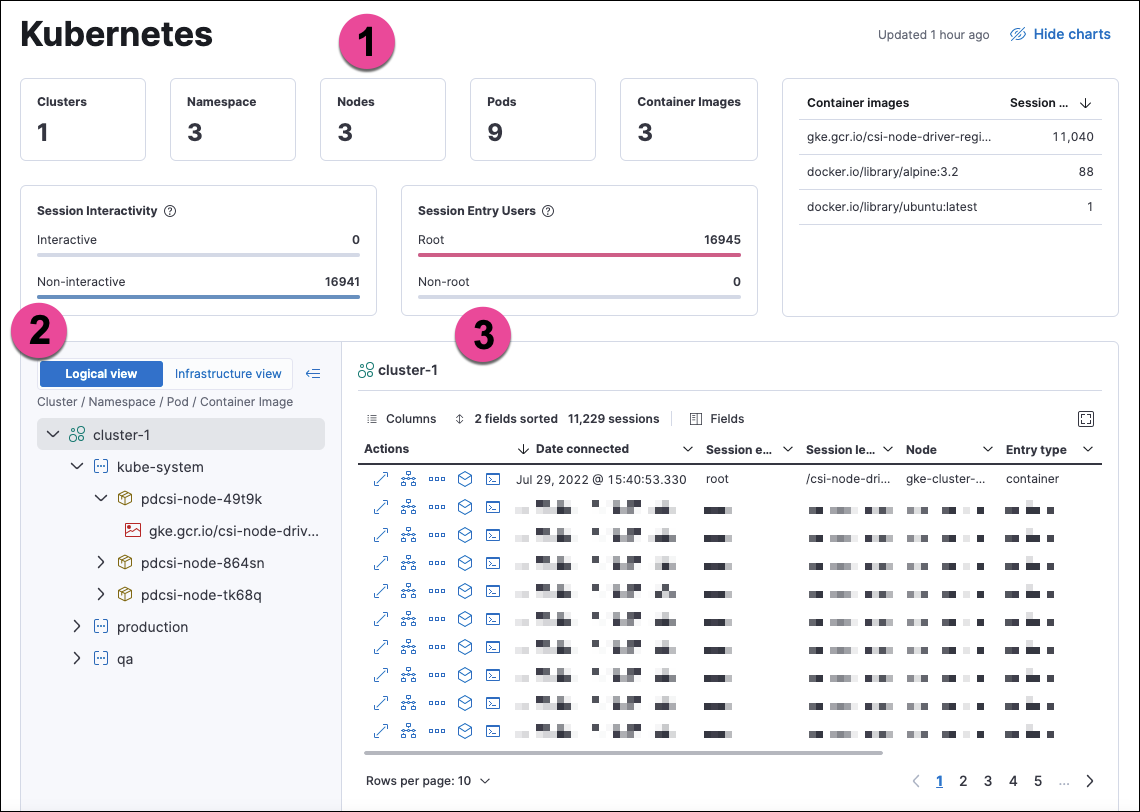
The numbered sections are described below:
- The charts at the top of the dashboard provide an overview of your monitored Kubernetes infrastructure. You can hide them by clicking Hide charts.
- The tree navigation menu allows you to navigate through your deployments and select the scope of the sessions table to the right. You can select any item in the menu to show its sessions. In Logical view, the menu is organized by Cluster, Namespace, Pod, and Container image. In Infrastructure view, it is organized by Cluster, Node, Pod, and Container image.
- The sessions table displays sessions collected from the selected element of your Kubernetes infrastructure. You can view it in fullscreen by selecting the button in the table’s upper right corner. You can sort the table by any of its fields.
You can filter the data using the KQL search bar and date picker at the top of the page.
From the sessions table’s Actions column, you can take the following investigative actions:
- View details
- Open in Timeline
- Run Osquery
- Analyze event
- Open Session View
Session View displays Kubernetes metadata under the Metadata tab of the Detail panel:
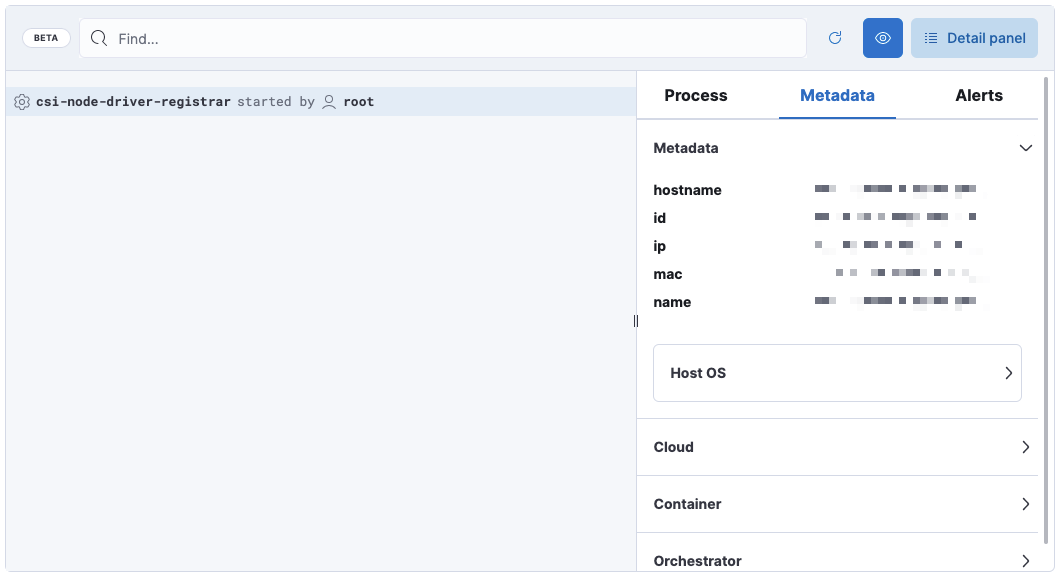
The Metadata tab is organized into these expandable sections:
- Metadata:
hostname,id,ip,mac,name, Host OS information - Cloud:
instance.name,provider,region,account.id,project.id - Container:
id,name,image.name,image.tag,image.hash.all - Orchestrator:
resource.ip,resource.name,resource.type,namespace,cluster.id,cluster.name,parent.type
To get data for this dashboard, set up Cloud Workload Protection for Kubernetes for the clusters you want to display on the dashboard.
This dashboard uses data from the logs-* index pattern, which is included by default in the securitySolution:defaultIndex advanced setting. To collect data from multiple Elasticsearch clusters (as in a cross-cluster deployment), update logs-* to *:logs-*.