Run a pattern analysis on log data
The Elastic Stack includes Elastic's core products such as Elasticsearch, Kibana, Logstash, and Beats. Availability This functionality is generally available and ready for production usage. Unless stated otherwise on the page, this functionality is available when your Elastic Stack is deployed on Elastic Cloud Hosted, Elastic Cloud Enterprise, Elastic Cloud on Kubernetes, and self-managed environments. This documentation corresponds to the latest patch available for each minor version. If you're not using the latest patch, check the release notes for changes.
Stack
Generally available
This functionality is in technical preview and may be changed or removed in a future release. Elastic will work to fix any issues, but features in technical preview are not subject to the support SLA of official GA features.
Log pattern analysis helps you find patterns in unstructured log messages and makes it easier to examine your data. When you run a pattern analysis, it performs categorization analysis on a selected field, creates categories based on the data, and then displays them together in a chart that shows the distribution of each category and an example document that matches the category. Log pattern analysis is useful when you want to examine how often different types of logs appear in your data set. It also helps you group logs in ways that go beyond what you can achieve with a terms aggregation.
Log pattern analysis works on every text field.
To run a log pattern analysis:
In your Elastic Observability Serverless project, go to Discover. If Discover opens in ES|QL mode, switch to classic mode. Then select All logs from the Data view menu.
Tip Elastic Cloud Serverless projects are autoscaled environments, fully managed by Elastic and available on Elastic Cloud. Availability Preview This functionality is in technical preview and is ready for evaluation. Use with caution in production; it is not recommended for mission-critical workloads. Elastic will work to fix any issues, but features in technical preview are not subject to the support SLA of official GA features. Specific Support terms apply. Serverless interfaces and procedures might differ from classic Elastic Stack deployments. The Elastic Stack includes Elastic's core products such as Elasticsearch, Kibana, Logstash, and Beats. Availability Preview since 9.4 This functionality is in technical preview and is ready for evaluation. Use with caution in production; it is not recommended for mission-critical workloads. Elastic will work to fix any issues, but features in technical preview are not subject to the support SLA of official GA features. Specific Support terms apply. Unless stated otherwise on the page, this functionality is available when your Elastic Stack is deployed on Elastic Cloud Hosted, Elastic Cloud Enterprise, Elastic Cloud on Kubernetes, and self-managed environments. This documentation corresponds to the latest patch available for each minor version. If you're not using the latest patch, check the release notes for changes.To group log messages by pattern in ES|QL mode instead, refer to Inspect grouped STATS results in Discover.
Apply any filters that you want.
If you don’t see any results, expand the time range, for example, to Last 15 days.
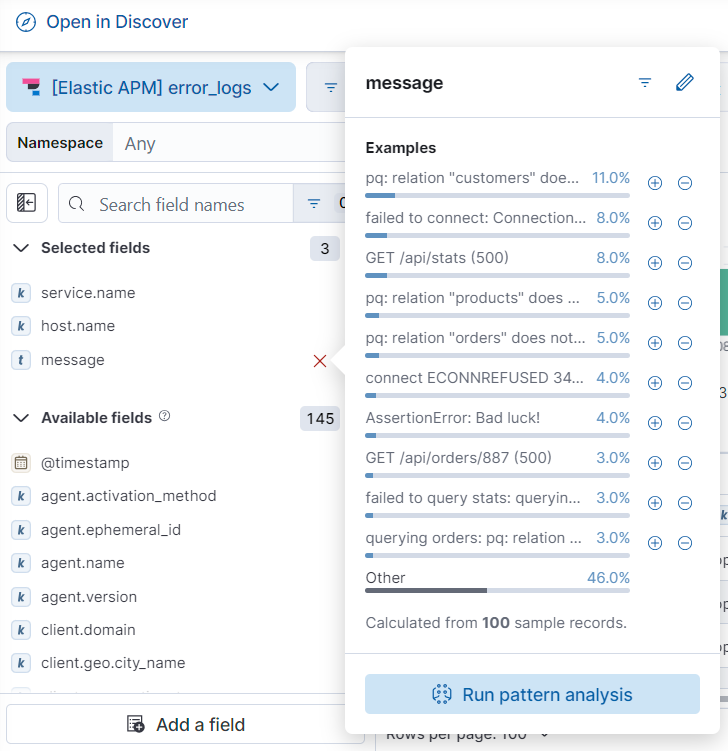
In the Available fields list, select the text field you want to analyze, then click Run pattern analysis.
The results of the analysis are shown in a table:
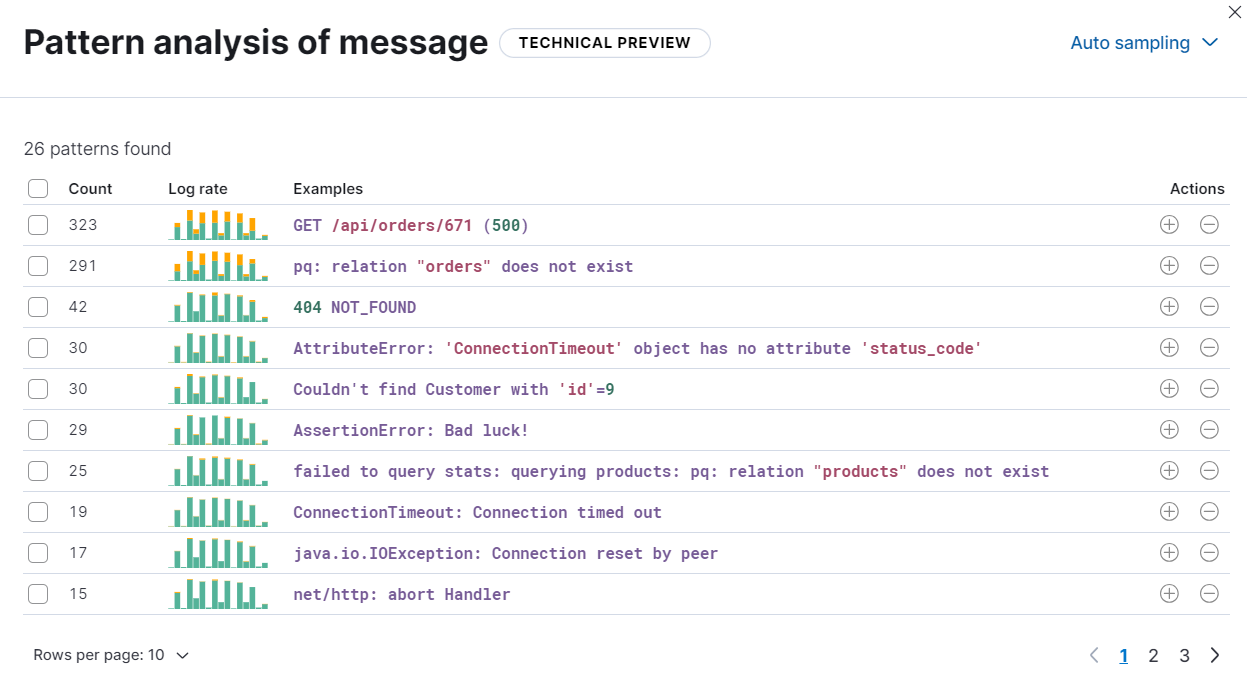
(Optional) Select one or more patterns, then choose to filter for (or filter out) documents that match the selected patterns. Discover only displays documents that match (or don’t match) the selected patterns. The filter options enable you to remove unimportant messages and focus on the more important, actionable data during troubleshooting.