Prometheus module
Elastic Cloud Serverless projects are autoscaled environments, fully managed by Elastic and available on Elastic Cloud. Availability This functionality is generally available and ready for production usage. Serverless interfaces and procedures might differ from classic Elastic Stack deployments. The Elastic Stack includes Elastic's core products such as Elasticsearch, Kibana, Logstash, and Beats. Availability This functionality is generally available and ready for production usage. Unless stated otherwise on the page, this functionality is available when your Elastic Stack is deployed on Elastic Cloud Hosted, Elastic Cloud Enterprise, Elastic Cloud on Kubernetes, and self-managed environments. This documentation corresponds to the latest patch available for each minor version. If you're not using the latest patch, check the release notes for changes.
Serverless
Generally available
Stack
Generally available
Refer to the Elastic Integrations documentation.
Learn more
Elastic Agent is a single, unified way to add monitoring for logs, metrics, and other types of data to a host. It can also protect hosts from security threats, query data from operating systems, forward data from remote services or hardware, and more. Refer to the documentation for a detailed comparison of Beats and Elastic Agent.
This module periodically scrapes metrics from Prometheus exporters.
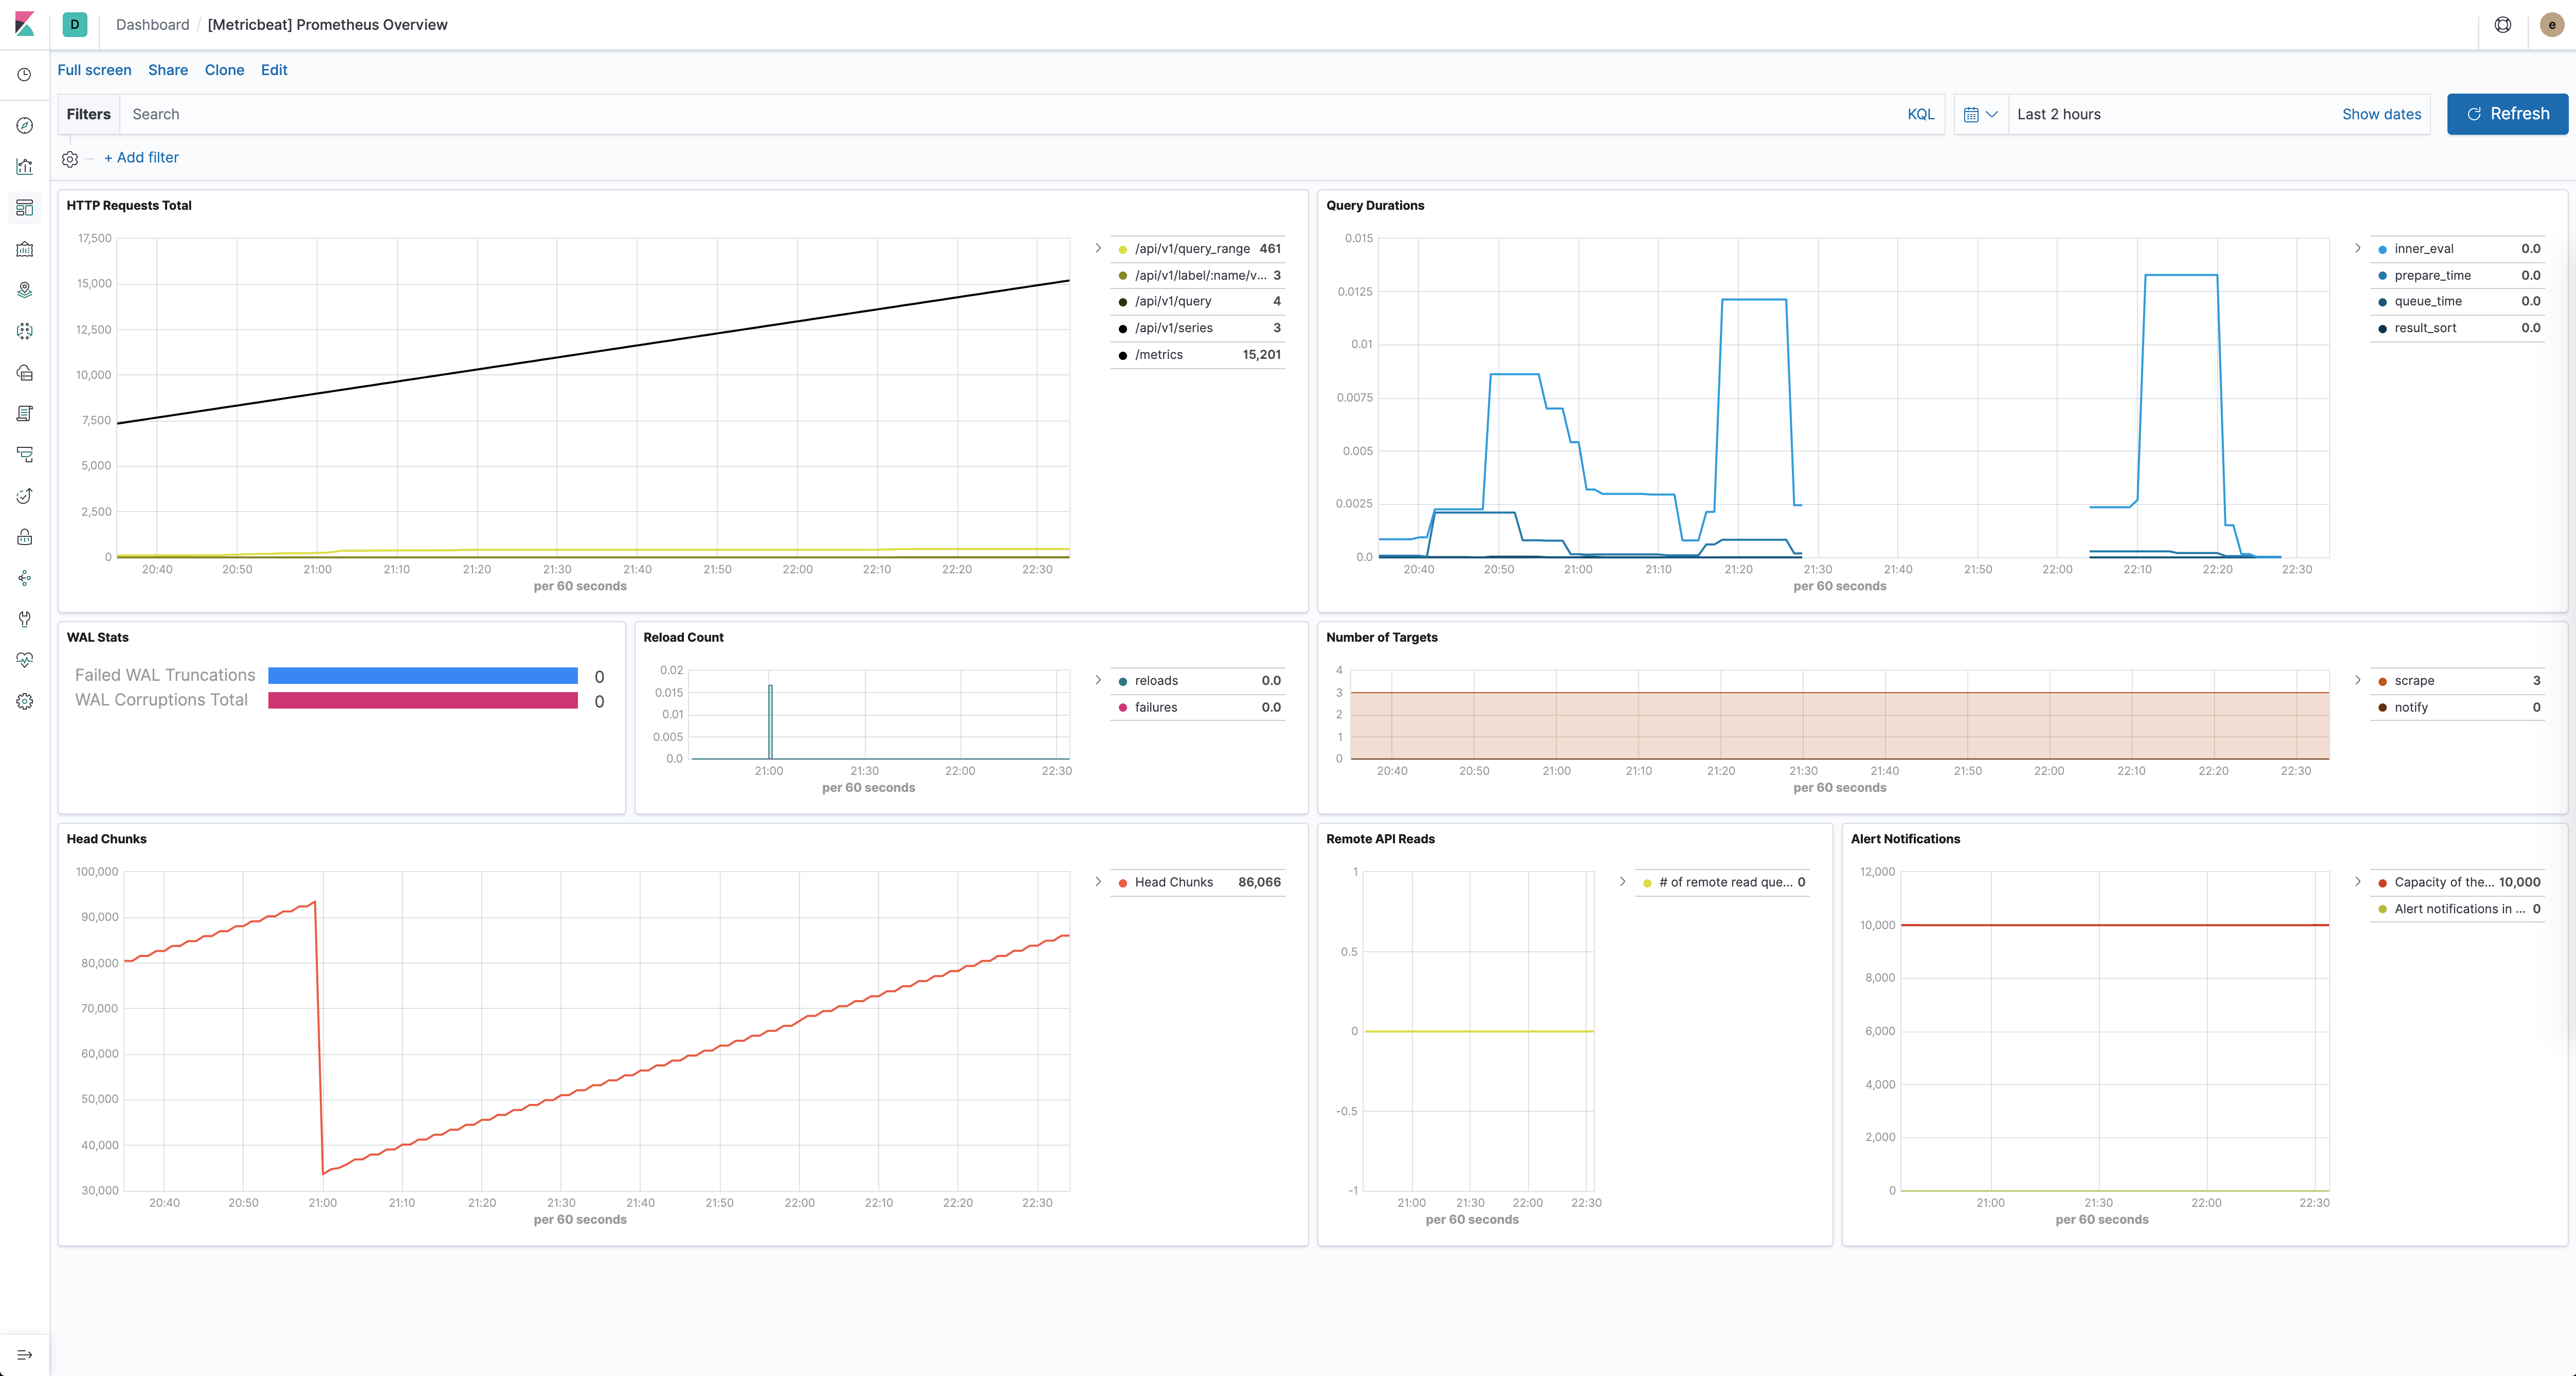
The Prometheus module comes with a predefined dashboard for Prometheus specific stats. For example:
The Prometheus module supports the standard configuration options that are described in Modules. Here is an example configuration:
metricbeat.modules:
# Metrics collected from a Prometheus endpoint
- module: prometheus
  period: 10s
  metricsets: ["collector"]
  hosts: ["localhost:9090"]
  metrics_path: /metrics
  #metrics_filters:
  #  include: []
  #  exclude: []
  #username: "user"
  #password: "secret"

  # Count number of metrics present in Elasticsearch document (default: false)
  #metrics_count: false

  # This can be used for service account based authorization:
  #bearer_token_file: /var/run/secrets/kubernetes.io/serviceaccount/token
  #ssl.certificate_authorities:
  #  - /var/run/secrets/kubernetes.io/serviceaccount/service-ca.crt


# Metrics sent by a Prometheus server using remote_write option
#- module: prometheus
#  metricsets: ["remote_write"]
#  host: "localhost"
#  port: "9201"

  # Count number of metrics present in Elasticsearch document (default: false)
  #metrics_count: false

  # Secure settings for the server using TLS/SSL:
  #ssl.certificate: "/etc/pki/server/cert.pem"
  #ssl.key: "/etc/pki/server/cert.key"

# Metrics that will be collected using a PromQL
#- module: prometheus
#  metricsets: ["query"]
#  hosts: ["localhost:9090"]
#  period: 10s
#  queries:
#  - name: "instant_vector"
#    path: "/api/v1/query"
#    params:
#      query: "sum(rate(prometheus_http_requests_total[1m]))"
#  - name: "range_vector"
#    path: "/api/v1/query_range"
#    params:
#      query: "up"
#      start: "2019-12-20T00:00:00.000Z"
#      end:  "2019-12-21T00:00:00.000Z"
#      step: 1h
#  - name: "scalar"
#    path: "/api/v1/query"
#    params:
#      query: "100"
#  - name: "string"
#    path: "/api/v1/query"
#    params:
#      query: "some_value"
This module supports TLS connections when using ssl config field, as described in SSL. It also supports the options described in Standard HTTP config options.
The following metricsets are available: