AWS lambda metricset
Elastic Cloud Serverless projects are autoscaled environments, fully managed by Elastic and available on Elastic Cloud. Availability This functionality is generally available and ready for production usage. Serverless interfaces and procedures might differ from classic Elastic Stack deployments. The Elastic Stack includes Elastic's core products such as Elasticsearch, Kibana, Logstash, and Beats. Availability This functionality is generally available and ready for production usage. Unless stated otherwise on the page, this functionality is available when your Elastic Stack is deployed on Elastic Cloud Hosted, Elastic Cloud Enterprise, Elastic Cloud on Kubernetes, and self-managed environments. This documentation corresponds to the latest patch available for each minor version. If you're not using the latest patch, check the release notes for changes.
Serverless
Generally available
Stack
Generally available
AWS Lambda monitors functions and sends metrics to Amazon CloudWatch. These metrics include total invocations, errors, duration, throttles, dead-letter queue errors, and iterator age for stream-based invocations.
Some specific AWS permissions are required for IAM user to collect AWS EBS metrics.
ec2:DescribeRegions
cloudwatch:GetMetricData
cloudwatch:ListMetrics
tag:getResources
sts:GetCallerIdentity
iam:ListAccountAliases
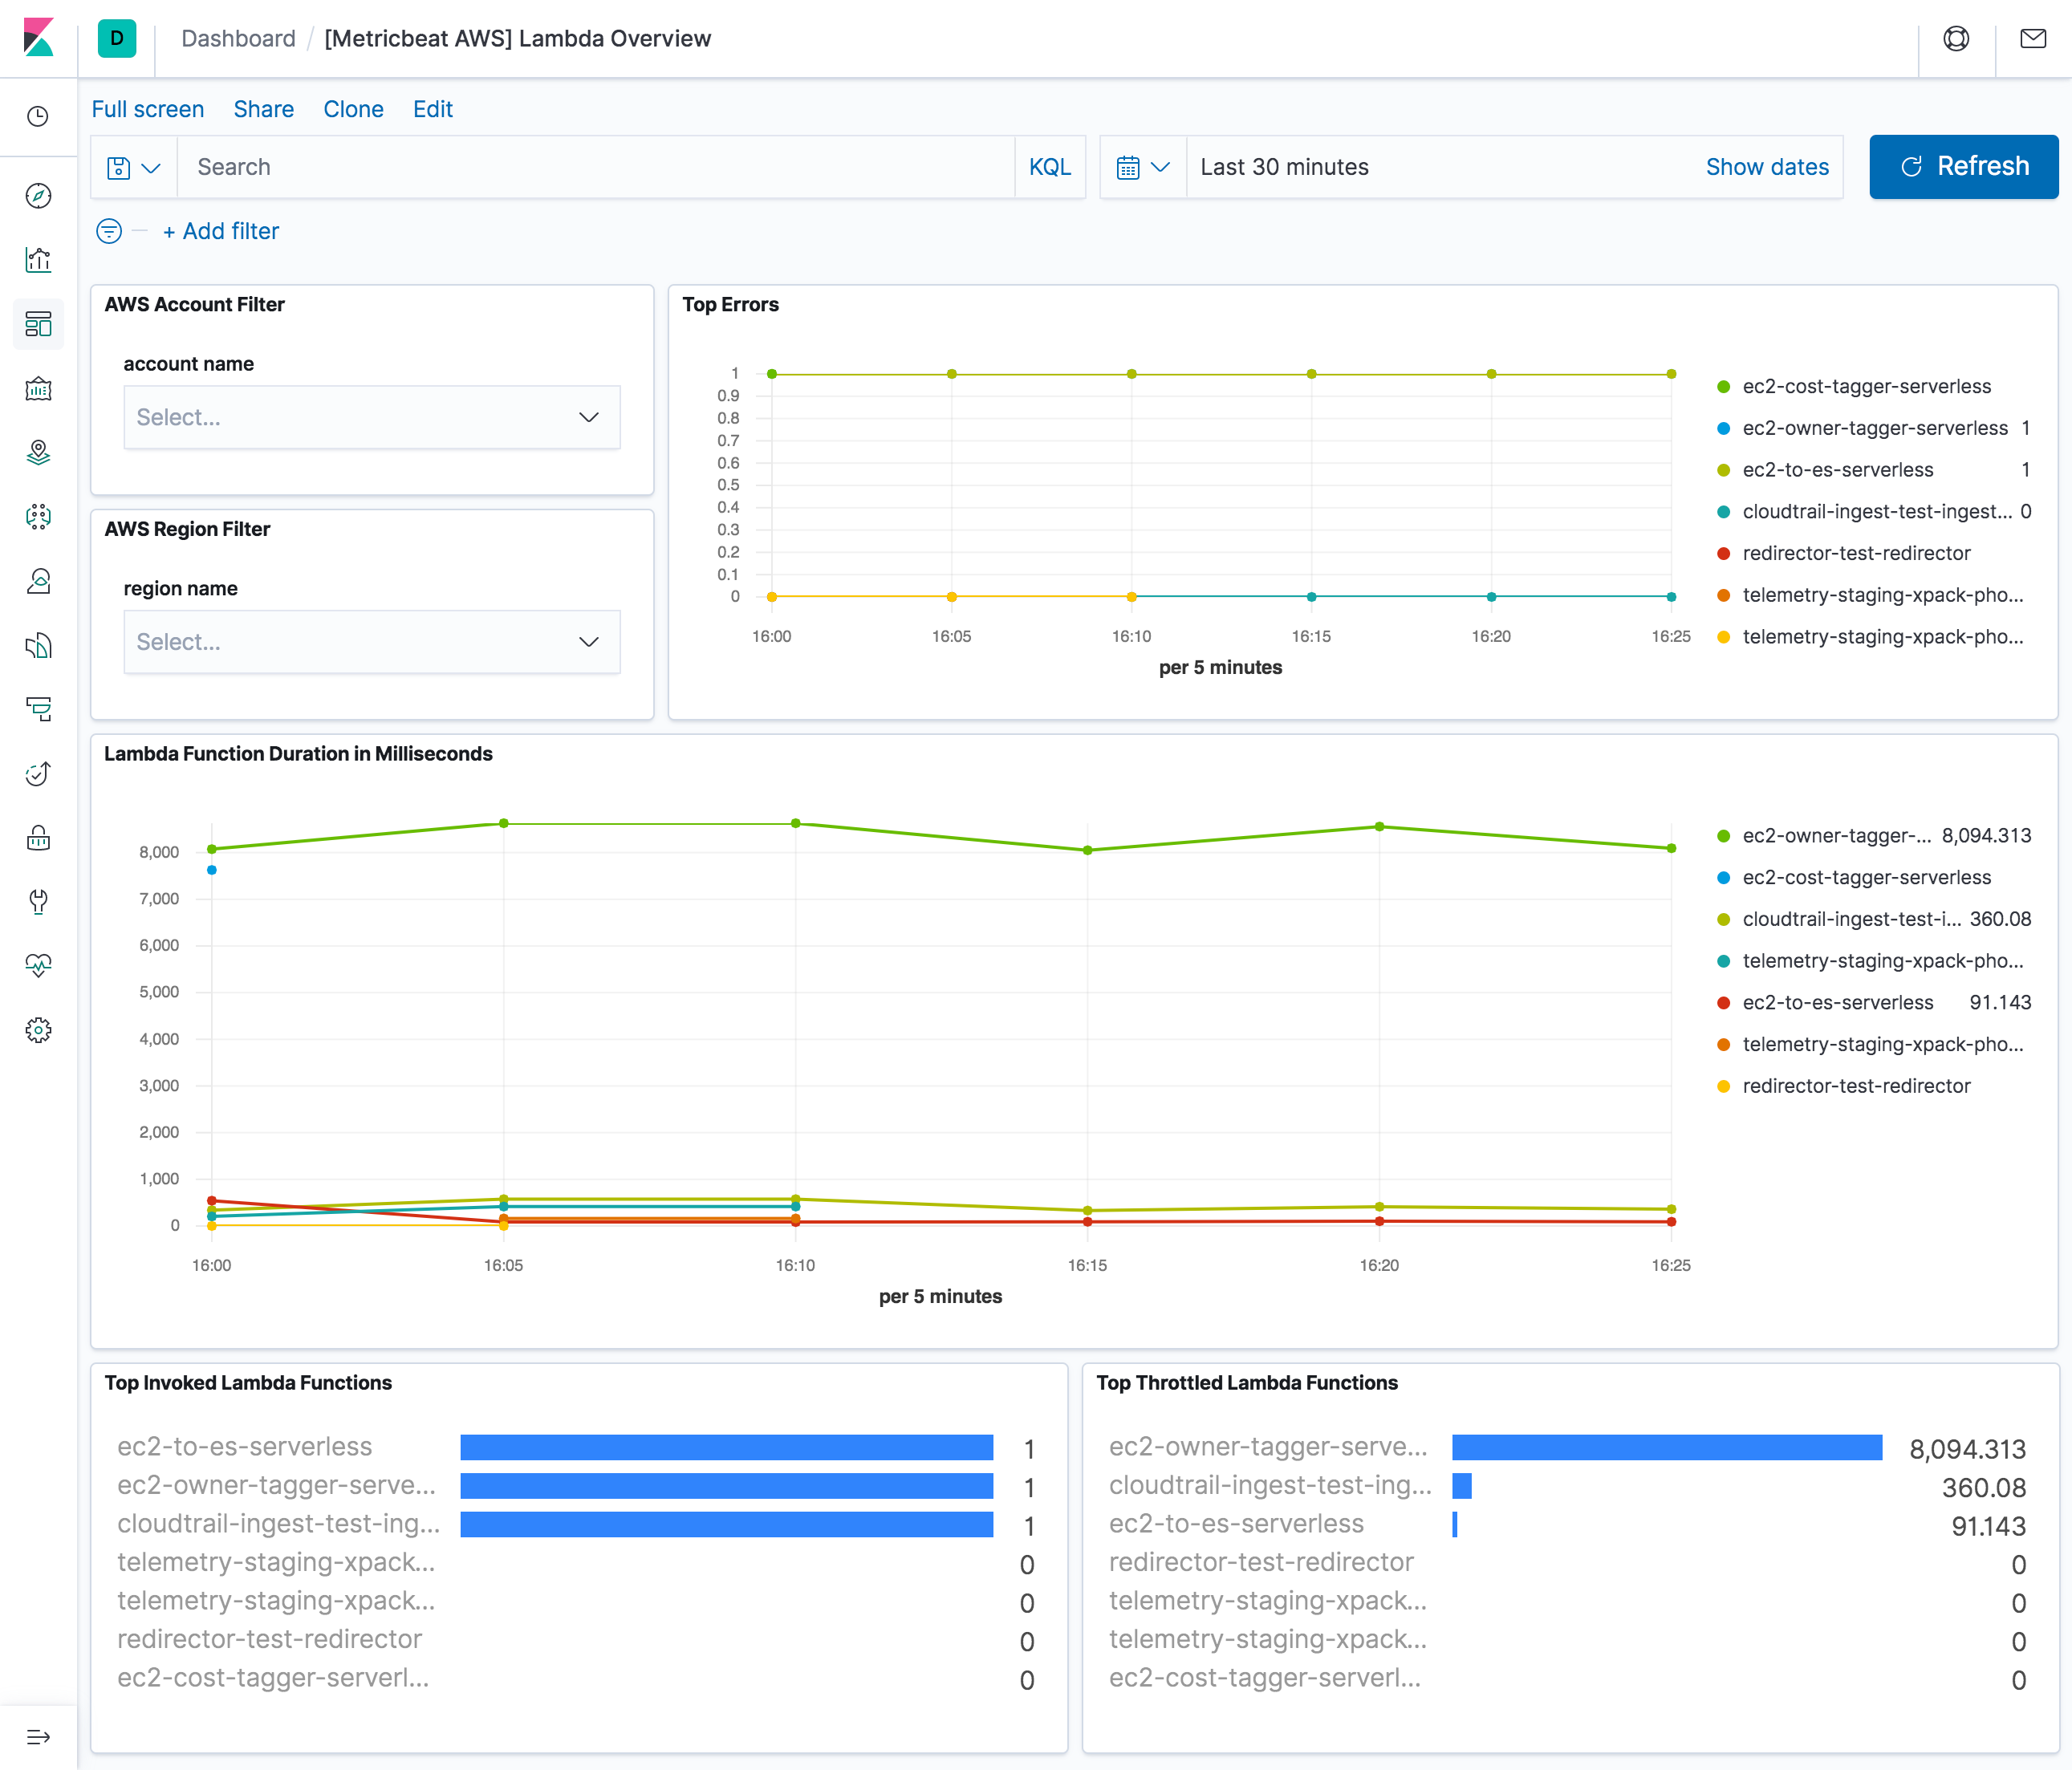
The aws lambda metricset comes with a predefined dashboard. For example:
- module: aws
  period: 300s
  metricsets:
    - lambda
  # This module uses the aws cloudwatch metricset, all
  # the options for this metricset are also available here.
Please see more details for each metric in lambda-cloudwatch-metric.
| Metric Name | Statistic Method |
|---|---|
| Invocations | Average |
| Errors | Average |
| DeadLetterErrors | Average |
| DestinationDeliveryFailures | Average |
| Duration | Average |
| Throttles | Average |
| IteratorAge | Average |
| ConcurrentExecutions | Average |
| UnreservedConcurrentExecutions | Average |
| ProvisionedConcurrentExecutions | Maximum |
| ProvisionedConcurrencyInvocations | Sum |
| ProvisionedConcurrencySpilloverInvocations | Sum |
| ProvisionedConcurrencyUtilization | Maximum |
This is a default metricset. If the host module is unconfigured, this metricset is enabled by default.
For a description of each field in the metricset, see the exported fields section.
Here is an example document generated by this metricset:
{
    "@timestamp": "2017-10-12T08:05:34.853Z",
    "aws": {
        "cloudwatch": {
            "namespace": "AWS/Lambda"
        },
        "dimensions": {
            "FunctionName": "ec2-owner-tagger-serverless",
            "Resource": "ec2-owner-tagger-serverless"
        },
        "lambda": {
            "metrics": {
                "Duration": {
                    "avg": 8218.073333333334
                },
                "Errors": {
                    "avg": 1
                },
                "Invocations": {
                    "avg": 1
                },
                "Throttles": {
                    "avg": 0
                }
            }
        }
    },
    "cloud": {
        "account": {
            "id": "627959692251",
            "name": "elastic-test"
        },
        "provider": "aws",
        "region": "us-west-2"
    },
    "event": {
        "dataset": "aws.lambda",
        "duration": 115000,
        "module": "aws"
    },
    "metricset": {
        "name": "lambda",
        "period": 10000
    },
    "service": {
        "type": "aws"
    }
}