Okta module
Elastic Cloud Serverless projects are autoscaled environments, fully managed by Elastic and available on Elastic Cloud. Availability This functionality is generally available and ready for production usage. Serverless interfaces and procedures might differ from classic Elastic Stack deployments. The Elastic Stack includes Elastic's core products such as Elasticsearch, Kibana, Logstash, and Beats. Availability This functionality is generally available and ready for production usage. Unless stated otherwise on the page, this functionality is available when your Elastic Stack is deployed on Elastic Cloud Hosted, Elastic Cloud Enterprise, Elastic Cloud on Kubernetes, and self-managed environments. This documentation corresponds to the latest patch available for each minor version. If you're not using the latest patch, check the release notes for changes.
Serverless
Generally available
Stack
Generally available
Refer to the Elastic Integrations documentation.
Learn more
Elastic Agent is a single, unified way to add monitoring for logs, metrics, and other types of data to a host. It can also protect hosts from security threats, query data from operating systems, forward data from remote services or hardware, and more. Refer to the documentation for a detailed comparison of Beats and Elastic Agent.
The Okta module collects events from the Okta API. Specifically this supports reading from the Okta System Log API.
Each fileset has separate variable settings for configuring the behavior of the module. If you don’t specify variable settings, the okta module uses the defaults.
For advanced use cases, you can also override input settings. See Override input settings.
When you specify a setting at the command line, remember to prefix the setting with the module name, for example, okta.system.var.paths instead of system.var.paths.
The Okta System Log records system events related to your organization in order to provide an audit trail that can be used to understand platform activity and to diagnose problems. This module is implemented using the httpjson input and is configured to paginate through the logs while honoring any rate-limiting headers sent by Okta.
This is an example configuration for the module.
- module: okta
  system:
    var.url: https://yourOktaDomain/api/v1/logs
    var.api_key: '00QCjAl4MlV-WPXM...0HmjFx-vbGua'
var.url-
Specifies the URL to the Okta System Log API. Required.
YAML var.url: https://mycompany.okta.com/api/v1/logs var.api_key-
Specifies the Okta API token to use in requests to the API. Required. The token is used in an HTTP
Authorizationheader with theSSWSscheme. See Create an API token for information on how to obtain a token.YAML var.api_key: '00QCjAl4MlV-WPXM...0HmjFx-vbGua' var.http_client_timeout- Duration of the time limit on HTTP requests made by the module. Defaults to
60s. var.interval- Duration between requests to the API. Defaults to
60s. var.keep_original_message- Boolean flag indicating if the original JSON event string should be included in the
event.originalfield. Defaults totrue. var.ssl-
Configuration options for SSL parameters like the certificate authority to use for HTTPS-based connections. If the
sslsection is missing, the host CAs are used for HTTPS connections to Okta. See SSL for more information.YAML var.ssl: supported_protocols: [TLSv1.2] var.initial_interval-
An initial interval can be defined. The first time the module starts, will fetch events from the current moment minus the initial interval value. Following restarts will fetch events starting from the last event read. It defaults to
24h.YAML var.initial_interval: 24h- will fetch events starting 24h ago.
input.request.rate_limit.early_limit-
You can override the default rate-limiting behavior in HTTP JSON. The default for the Okta module is to use up to 89% of the Okta rate-limit, which should avoid Okta Warnings on rate-limit usage.
Text input.request.rate_limit.early_limit: 0.89
This module comes with a sample dashboard:
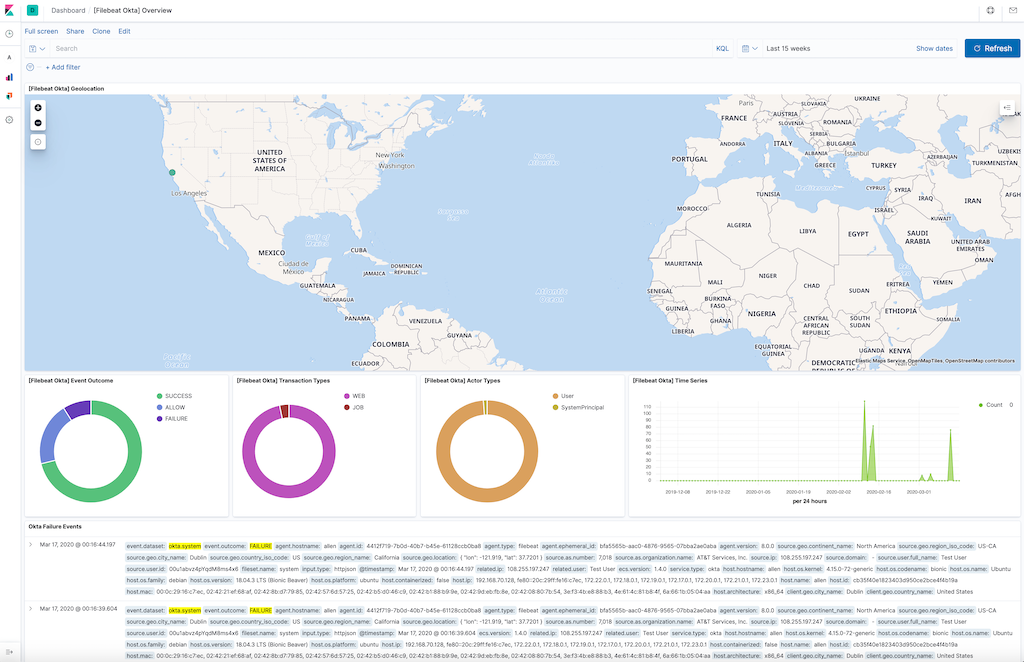
For a description of each field in the module, see the exported fields section.