IIS application_pool metricset
Elastic Cloud Serverless projects are autoscaled environments, fully managed by Elastic and available on Elastic Cloud. Availability This functionality is generally available and ready for production usage. Serverless interfaces and procedures might differ from classic Elastic Stack deployments. The Elastic Stack includes Elastic's core products such as Elasticsearch, Kibana, Logstash, and Beats. Availability This functionality is generally available and ready for production usage. Unless stated otherwise on the page, this functionality is available when your Elastic Stack is deployed on Elastic Cloud Hosted, Elastic Cloud Enterprise, Elastic Cloud on Kubernetes, and self-managed environments. This documentation corresponds to the latest patch available for each minor version. If you're not using the latest patch, check the release notes for changes.
Serverless
Generally available
Stack
Generally available
This is the application_pool metricset of the module iis.
This metricset allows users to retrieve relevant metrics for the application pools running on IIS.
Metric values are divided in several groups:
The process object contains System/Process counters like the overall server and CPU usage for the IIS Worker Process and memory (currently used and available memory for the IIS Worker Process).
The net_clr object which returns ASP.NET error rate counter values. Users can specify the application pools they would like to monitor using the configuration option application_pool.name, else, all application pools are considered.
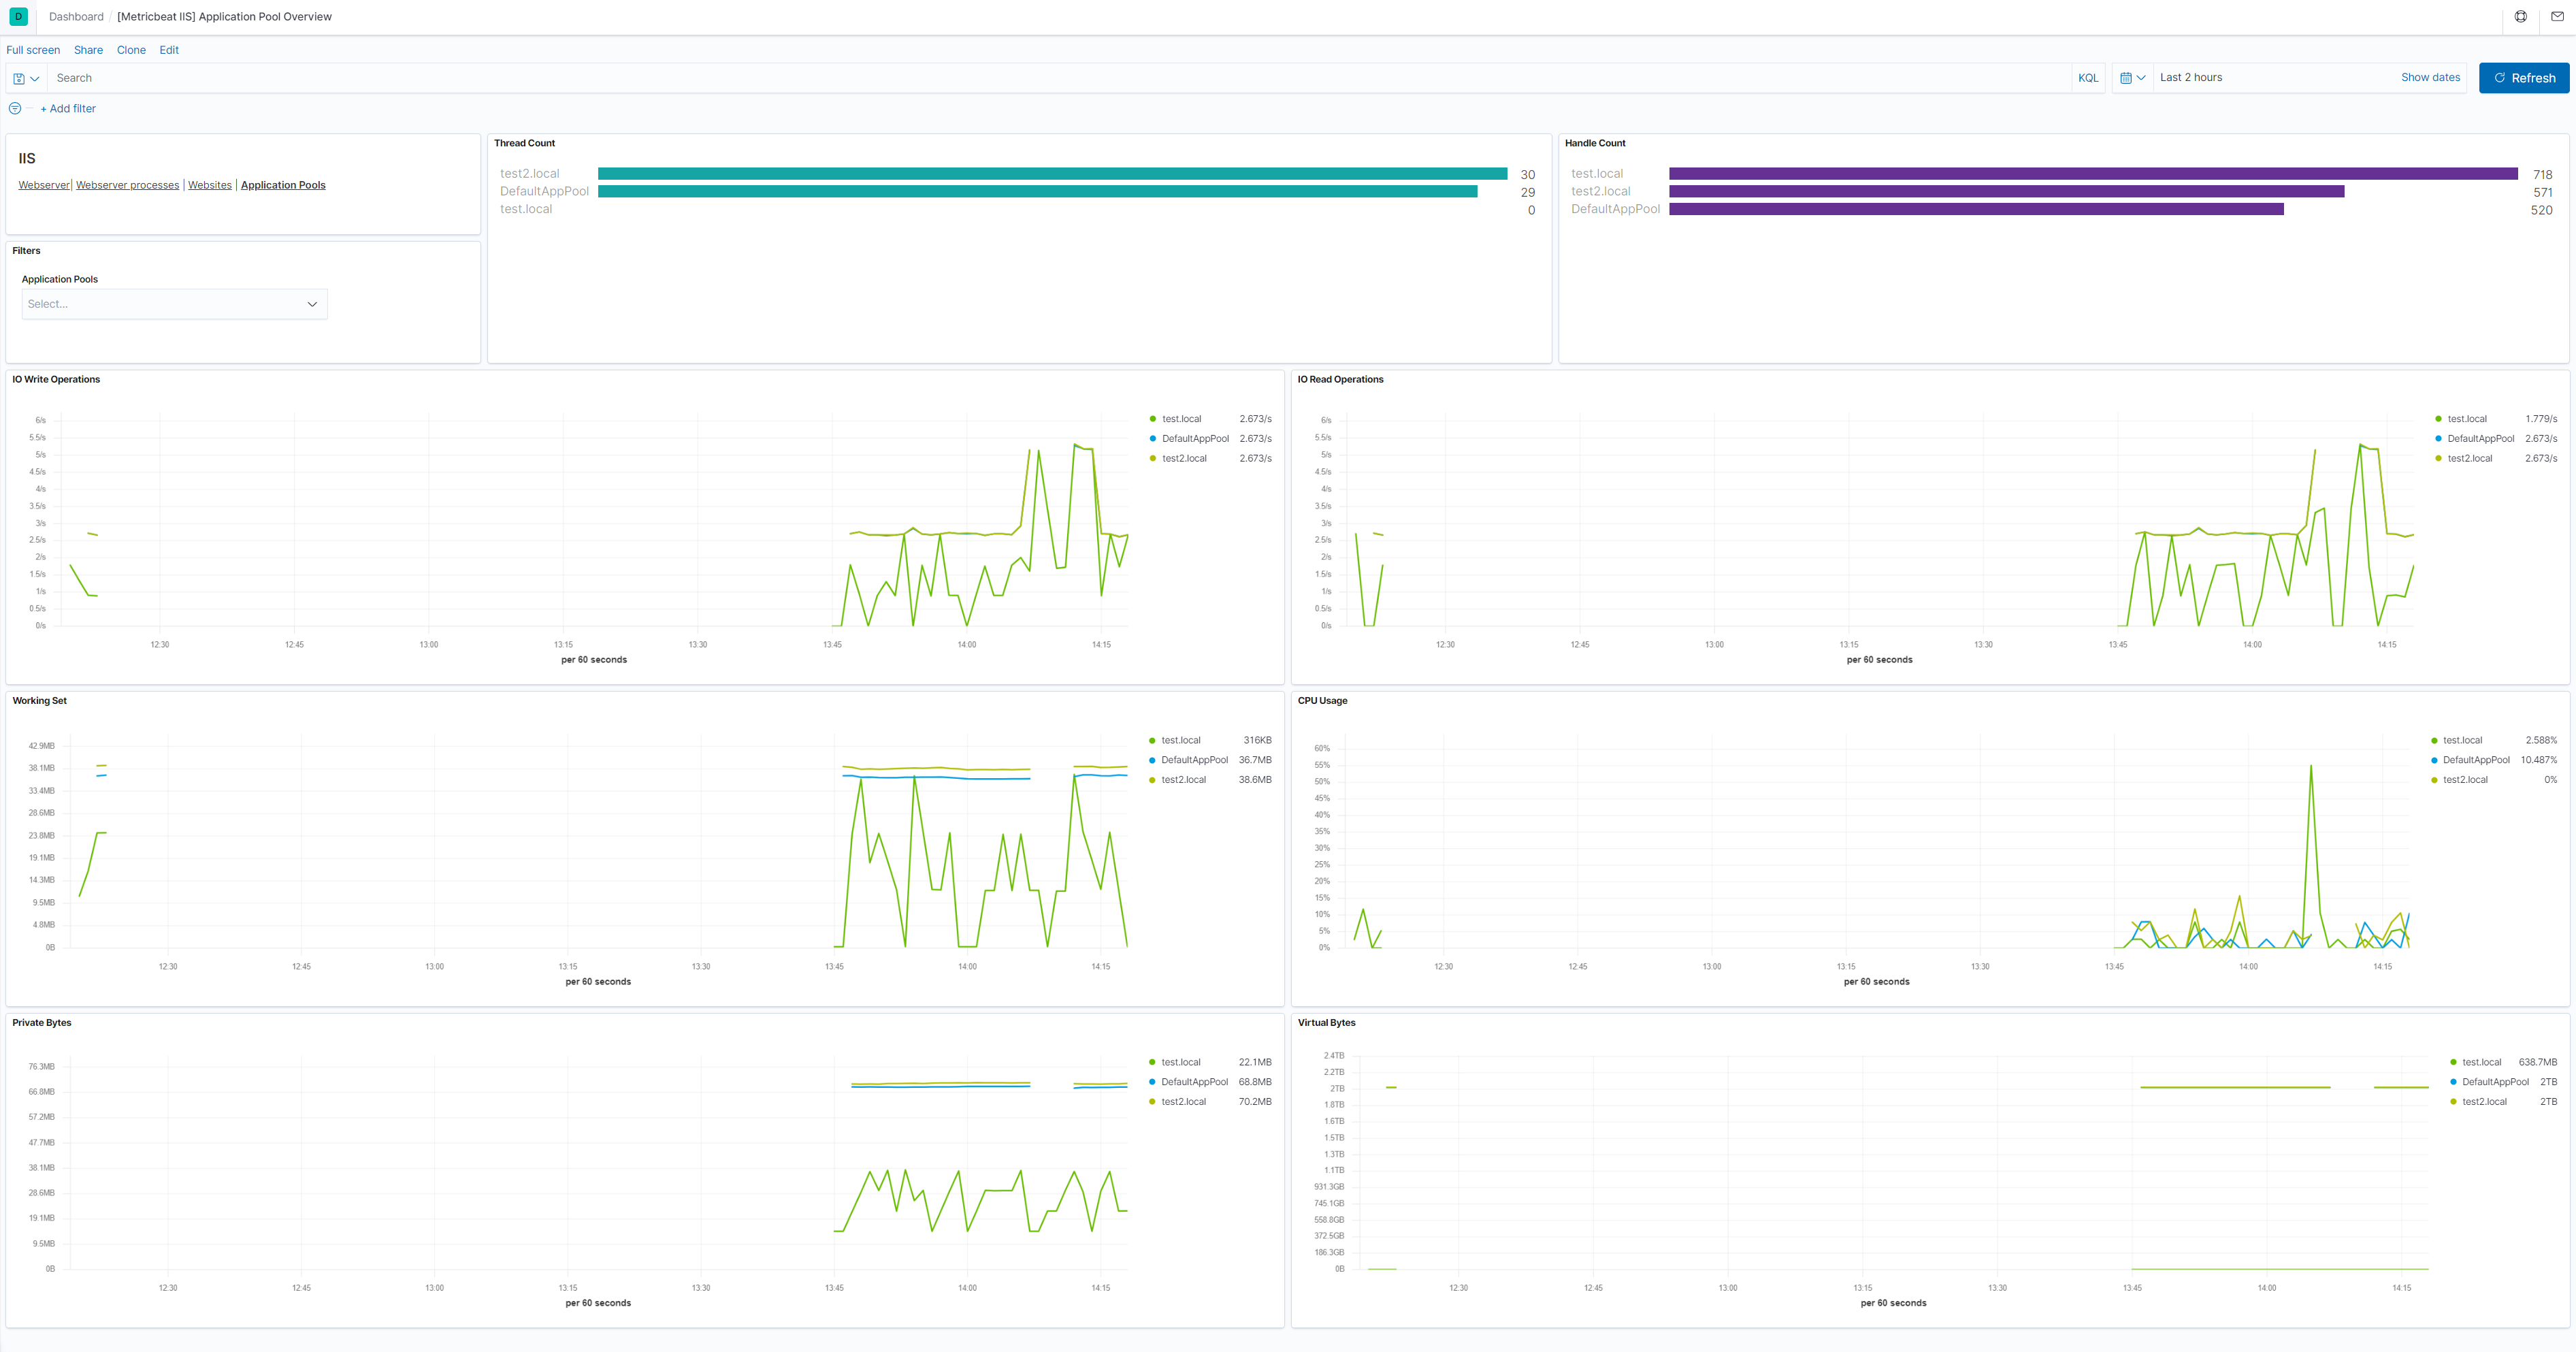
For a description of each field in the metricset, see the exported fields section.
Here is an example document generated by this metricset:
{
    "@timestamp": "2026-01-31T00:26:10.412Z",
    "event": {
        "dataset": "iis.application_pool",
        "module": "iis",
        "duration": 32222100
    },
    "iis": {
        "application_pool": {
            "name": "DefaultAppPool",
            "process": {
                "working_set": 19296256,
                "virtual_bytes": 2203429777408,
                "page_faults_per_sec": 0,
                "io_write_operations_per_sec": 0.500673761687841,
                "private_bytes": 6021120,
                "thread_count": 22,
                "handle_count": 239,
                "cpu_usage_perc": 1.5646088737165276,
                "io_read_operations_per_sec": 0.500673761687841
            },
            "host": {
                "cpu": {
                    "count": 16
                }
            }
        }
    },
    "metricset": {
        "name": "application_pool",
        "period": 10000
    },
    "process": {
        "pid": 24056
    },
    "service": {
        "type": "iis"
    }
}