Capture Elastic Agent diagnostics
Elastic Cloud Serverless projects are autoscaled environments, fully managed by Elastic and available on Elastic Cloud. Availability This functionality is generally available and ready for production usage. Serverless interfaces and procedures might differ from classic Elastic Stack deployments. The Elastic Stack includes Elastic's core products such as Elasticsearch, Kibana, Logstash, and Beats. Availability This functionality is generally available and ready for production usage. Unless stated otherwise on the page, this functionality is available when your Elastic Stack is deployed on Elastic Cloud Hosted, Elastic Cloud Enterprise, Elastic Cloud on Kubernetes, and self-managed environments. This documentation corresponds to the latest patch available for each minor version. If you're not using the latest patch, check the release notes for changes.
Serverless
Generally available
Stack
Generally available
Elastic's diagnostic tools capture point-in-time snapshots of Fleet and Elastic Agent related statistics and logs. They work against all product versions.
Their information can be used to troubleshoot problems with your setup. You can generate diagnostic information using this tool before escalating to us to minimize turnaround time.
This archive file is redacted for privacy as much as possible, but might still contain host-identifying metadata such as IP addresses or domain information. You should not upload this output to public forums. Uploads to the Elastic Support Portal are handled in accordance with the Elastic Privacy Statement.
For Fleet-managed Elastic Agents, the related settings and states can be surfaced by:
- Kibana from the Kibana Fleet APIs
- Elastic Agent and Fleet from their command reference
Standalone Elastic Agents are not associated to Kibana nor Fleet, but their diagnostics are still accessible from the CLI.
To pull data from the respective applicable locations, refer to:
- Capture Kibana diagnostics
- Collect Elastic Agent diagnostics
-
Note Elastic Cloud Hosted lets you manage and configure one or more deployments of the versioned Elastic Stack, hosted on Elastic Cloud. Availability Generally available This functionality is generally available and ready for production usage.
To pull Elastic Agent diagnostics for the managed Fleet Server on your hosted deployment, you have to use the Fleet UI. The Fleet Server agent is associated with a managed agent policy named "Elastic Cloud agent policy".
Note Elastic Cloud Serverless projects are autoscaled environments, fully managed by Elastic and available on Elastic Cloud. Availability Unavailable This functionality is not available in Elastic Cloud Serverless. The Elastic Stack includes Elastic's core products such as Elasticsearch, Kibana, Logstash, and Beats. Availability Preview from 9.1 to 9.4 This functionality is in technical preview and is ready for evaluation. Use with caution in production; it is not recommended for mission-critical workloads. Elastic will work to fix any issues, but features in technical preview are not subject to the support SLA of official GA features. Specific Support terms apply. Unless stated otherwise on the page, this functionality is available when your Elastic Stack is deployed on Elastic Cloud Hosted, Elastic Cloud Enterprise, Elastic Cloud on Kubernetes, and self-managed environments. This documentation corresponds to the latest patch available for each minor version. If you're not using the latest patch, check the release notes for changes.To pull Elastic Managed integration diagnostics, you have to use the Fleet UI. To display Managed integration resources in Fleet, refer to Show Elastic Managed integration resources.
You need to determine which diagnostic types are needed to investigate your specific issue. This table shows common troubleshooting situations and which diagnostics are commonly associated:
| Situation | Kibana | Elastic Agent | Fleet |
|---|---|---|---|
| Kibana reports there's no Fleet Server | Yes | No | Yes |
| Elastic Agent is unable to connect to Fleet | No | Yes | Yes |
| Elastic Agent component or integration errors | No | Yes | No |
| Elastic Agent update issues or desynced status | Yes | Yes | No |
When in doubt, start with the Kibana and Elastic Agent diagnostics.
Some Elastic Agent configuration issues only appear in the agent's start-up debug logs. This is more common for cloud-connecting Elastic integrations which maintain checkpoints. This can cause later logs to only document that the subprocess has stopped or that it has not changed state after an earlier error. In these situations, follow these steps:
- Enable
debuglogging. - Restart Elastic Agent.
- Wait 10 minutes for the changes to sync from the Fleet Server to the Elastic Agent and for the Elastic Agent to restart.
- Pull the Elastic Agent diagnostics using your preferred method.
- Disable
debuglogging.
Elastic Agent comes bundled with a diagnostics command which generates a zip archive containing troubleshooting diagnostic information. This export is intended only for debugging purposes and its structure can change between releases.
The Fleet UI provides the ability to remotely generate and gather an Elastic Agent's diagnostics bundle if it is online in a Healthy or Unhealthy status. For Elastic Agents in other statuses, you must use the CLI to grab their diagnostic.
When OTel-based Elasticsearch monitoring is active, the bundle also includes elastic-agent-metrics.ndjson (capped at 20 MB). This file contains raw collector metric snapshots useful for diagnosing OTel monitoring pipeline issues.
Diagnostics and logs mainly emit product metadata and settings, but they might expose sensitive data which needs to be redacted before being shared outside of your organization. For more details, refer to Sanitize.
The diagnostics are sent to Fleet Server which in turn sends it to Elasticsearch. Therefore, this works even with Elastic Agents that are not using the Elasticsearch output.
To pull diagnostics related to an Elastic Managed integration, you first need to display the related resources in Fleet. Refer to Show Elastic Managed integration resources for details.
To download the diagnostics bundle for local viewing:
In Fleet, open the Agents tab.
In the Host column, click the agent’s name.
Select the Diagnostics tab and click the Request diagnostics .zip button.
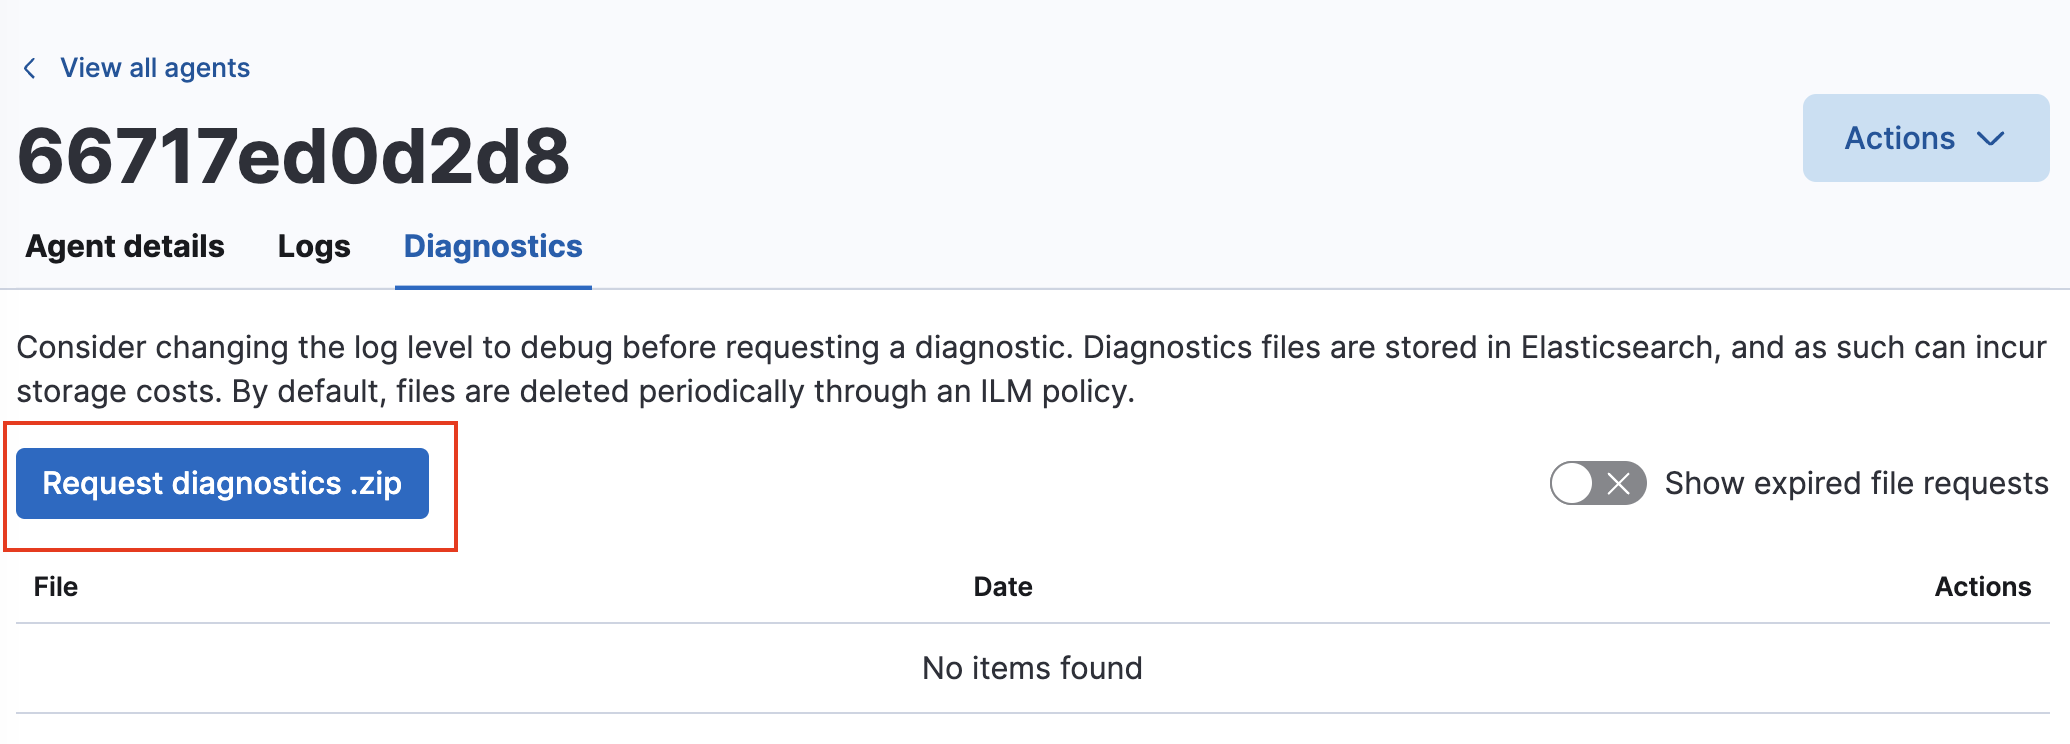
In the Request diagnostics pop-up, select Collect additional CPU metrics if you’d like detailed CPU data.
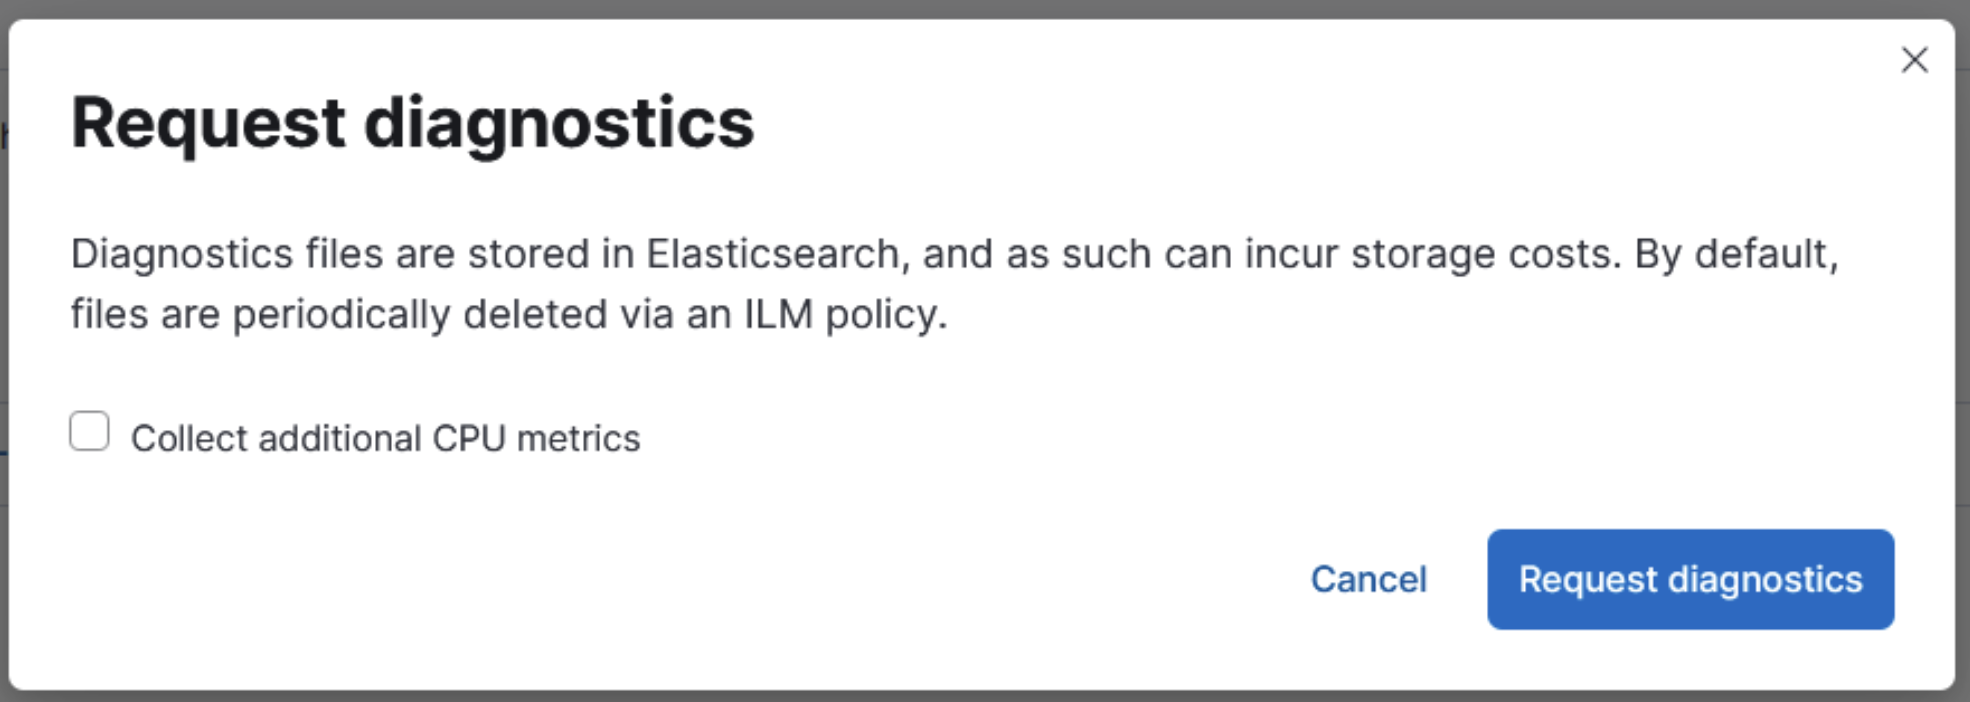
Click the Request diagnostics button.
When it is available, the new diagnostics bundle is listed on the Diagnostics tab along with any in-progress or previously collected bundles for the Elastic Agent.
The diagnostics bundles are stored in Elasticsearch and are removed automatically after 7 days. You can also delete any previously created bundles by clicking the trash can icon.
Run the diagnostics command in the Elastic Agent's install directory. Depending on your operating system, run:
Linux-based systems
Shell cd /opt/Elastic/Agent .elastic-agent diagnosticsWindows Powershell
Shell cd "C:\Program Files\Elastic\Agent" .\elastic-agent.exe diagnosticsApple MacOS
Shell sudo -i cd /Library/Elastic/Agent ./elastic-agent diagnosticsDocker
- Determine the container ID with Docker
ps.
Shell docker ps | grep "beats/elastic-agent"- Use Docker
execto run the diagnostics, replacing theCONTAINER_IDplaceholder.
Shell docker exec -it CONTAINER_ID elastic-agent diagnosticsNote the filename and location of the output file.
- Use Docker
cpto copy the diagnostic file to your local machine, replacing theCONTAINER_IDandFILE_NAMEplaceholders:
Shell docker cp CONTAINER_ID:/usr/share/elastic-agent/FILE_NAME FILE_NAME- Determine the container ID with Docker
Kubernetes
- Determine the container ID with
get.
Shell kubectl get pods --all-namespaces | grep agent- Run the diagnostics with
exec, replacing theNAMESPACEandPOD_NAMEplaceholders:
Shell kubectl exec --stdin --tty POD_NAME -n NAMESPACE -- elastic-agent diagnosticsNote the filename and location of the output file.
- Use
cpto copy the diagnostic file to your local machine, replacing theNAMESPACE,POD_NAME, andFILE_NAMEplaceholders.
Shell kubectl cp NAMESPACE/POD_NAME:FILE_NAME FILE_NAME- Determine the container ID with
Elastic Agent attempts to automatically redact credentials and API keys when creating its diagnostic files. Review the contents of the archive before sharing it to ensure that all forms of organizational private information is censored as needed. For example, ensure:
There are no credentials in plain text in the
*.yamldiagnostic files.The raw form of events failing to output is shown in
*.ndjson. By default, onlywarnlogs are registered. To log all events, enable thedebuglogging level. If you want to omit the raw events from the diagnostics, add the flag--exclude-events.