Monitoring UI
The Elastic Stack includes Elastic's core products such as Elasticsearch, Kibana, Logstash, and Beats. Availability This functionality is generally available and ready for production usage. Unless stated otherwise on the page, this functionality is available when your Elastic Stack is deployed on Elastic Cloud Hosted, Elastic Cloud Enterprise, Elastic Cloud on Kubernetes, and self-managed environments. This documentation corresponds to the latest patch available for each minor version. If you're not using the latest patch, check the release notes for changes.
Stack
Generally available
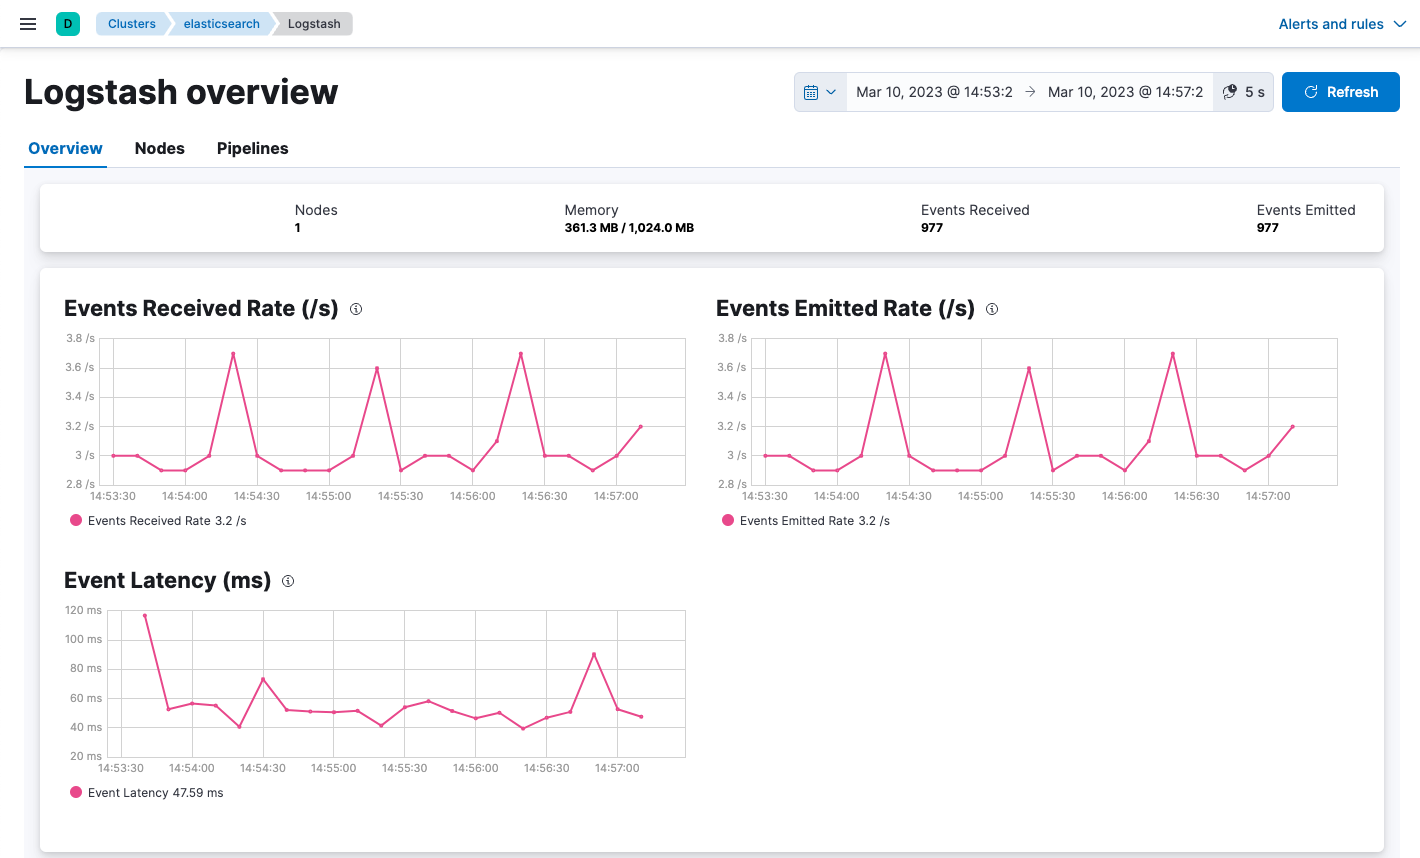
Use the Elastic Stack monitoring features to view metrics and gain insight into how your Logstash deployment is running. In the overview dashboard, you can see all events received and sent by Logstash, plus info about memory usage and uptime:
Then you can drill down to see stats about a specific node:
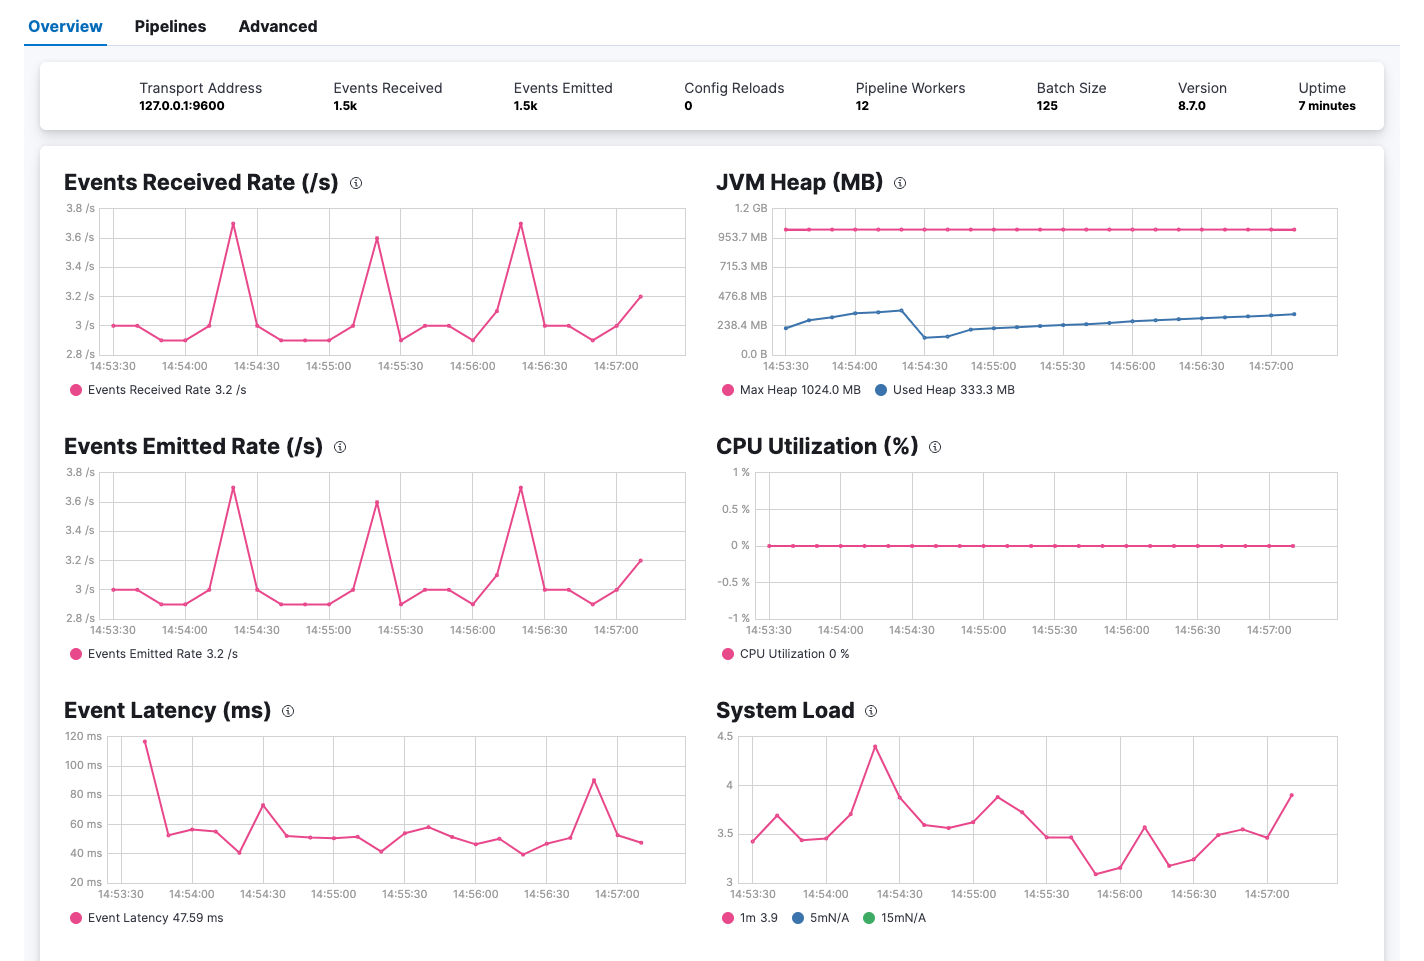
A Logstash node is considered unique based on its persistent UUID, which is written to the path.data directory when the node starts.
Before you can use the monitoring UI, configure Logstash monitoring.
For information about using the Monitoring UI, see X-Pack monitoring in Kibana.