---
title: Host Traffic Anomalies
description: The Host Traffic Anomalies package includes a dashboard that offers a high-level overview of Anomaly Detection alerts coming from our prebuilt ML security...
url: https://www.elastic.co/docs/reference/integrations/hta
products:
- Elastic integrations
applies_to:
- Serverless Security projects: Generally available
- Elastic Stack: Generally available since 9.4
---
# Host Traffic Anomalies
| | |
|-------------------------------------------------------------------------------------------------|--------------------------------|
| **Version** | 2.0.1 ([View all](#changelog)) |
| **Subscription level**[What's this?](https://www.elastic.co/subscriptions) | Platinum |
| **Developed by**[What's this?](https://www.elastic.co/docs/reference/integrations/developed-by) | Elastic |
| **Minimum Kibana version(s)** | 9.4.0 |
The Host Traffic Anomalies package includes a dashboard that offers a high-level overview of Anomaly Detection alerts coming from our prebuilt ML security module, `Security: Host`.
## Installation
1. **Add the Integration Package**: Install the package via **Management > Integrations > Add Host Traffic Anomalies**.
2. **Start preconfigured anomaly detection jobs**: Go to **Machine Learning** -> Under **Anomaly Detection**, select **Jobs** -> Click **Create anomaly detection job button** -> Select your data view (ex: "logs-*") -> Select **Security: Host** -> Click **Create jobs**.
3. **Data view configuration for Dashboards**: For the dashboard to work as expected, the following settings need to be configured in Kibana.
1. You have started the above anomaly detection jobs.
2. You have **read** access to `.ml-anomalies-shared` data stream/index or are assigned the `machine_learning_user` role. For more information on roles, please refer to [Built-in roles in Elastic](https://www.elastic.co/guide/en/elasticsearch/reference/current/built-in-roles.html). Please be aware that a user who has access to the underlying machine learning results indices can see the results of *all* jobs in *all* spaces. Be mindful of granting permissions if you use Kibana spaces to control which users can see which machine learning results. For more information on machine learning privileges, refer to [setup-privileges](https://www.elastic.co/guide/en/machine-learning/current/setup.html#setup-privileges).
3. After enabling the jobs, go to **Management > Stack Management > Kibana > Data Views**. Click on **Create data view** with the following settings:
- Name: `.ml-anomalies-shared`
- Index pattern : `.ml-anomalies-shared*`
- Select **Show Advanced settings** enable **Allow hidden and system indices**
- Custom data view ID: `.ml-anomalies-shared`
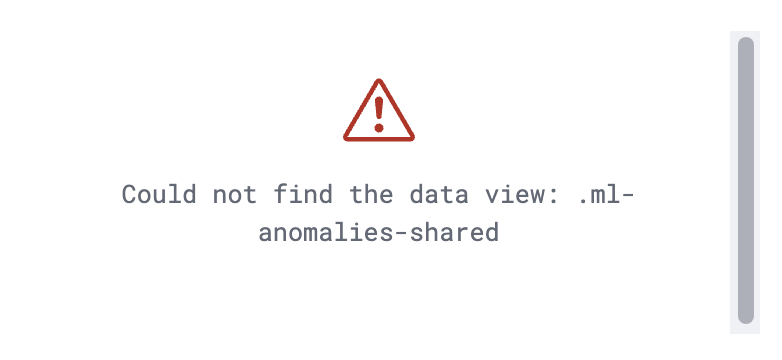
***Warning***: When creating the data views for the dashboards, ensure that the `Custom data view ID` is set to the value specified above and is not left empty. Omitting or misconfiguring this field may result in broken visualizations, as illustrated by the error message below.
## v2.0.0 and beyond
v2.0.0 of this package requires Elastic Stack version 9.4 or later. It introduces support for Entity Analytics (EA), adding new fields for proper entity resolution.
- This package installs new ML jobs which include `_ea` suffix in their names, as outlined below. These jobs are available through the `Security: Host` module in Kibana. To install them, go to **Machine Learning** -> **Anomaly Detection** -> **Jobs** -> **Create anomaly detection job** -> select your data view -> select **Security: Host** -> **Create jobs**.
- Previously installed `Security: Host` ML jobs will continue to run, allowing time to transition to the new Entity Analytics jobs.
- **Important**: We recommend installing the new ML jobs and verifying that they are properly set up, collecting data, and generating anomalies **before** deleting the old jobs and upgrading to the new version of the detection rules available in 9.4. The new detection rules reference ML job IDs with the `_ea` suffix and are not compatible with older versions of the jobs.
- A new dashboard is available in this version with the suffix "(Entity Analytics)" in the title. If you are still running jobs from before this version, the original dashboard without the suffix remains available.
The new Entity Analytics ML job IDs for this dashboard are:
- `high_count_events_for_a_host_name_ea`
- `low_count_events_for_a_host_name_ea`
After confirming the new Entity Analytics ML jobs are running correctly, you can remove the following deprecated assets that have been superseded by the new Entity Analytics versions (Elastic stack 9.4+):
- Delete old ML jobs: Navigate to **Stack Management -> Anomaly Detection Jobs** and delete the following jobs:
- `high_count_events_for_a_host_name`
- `low_count_events_for_a_host_name`
## Screenshots
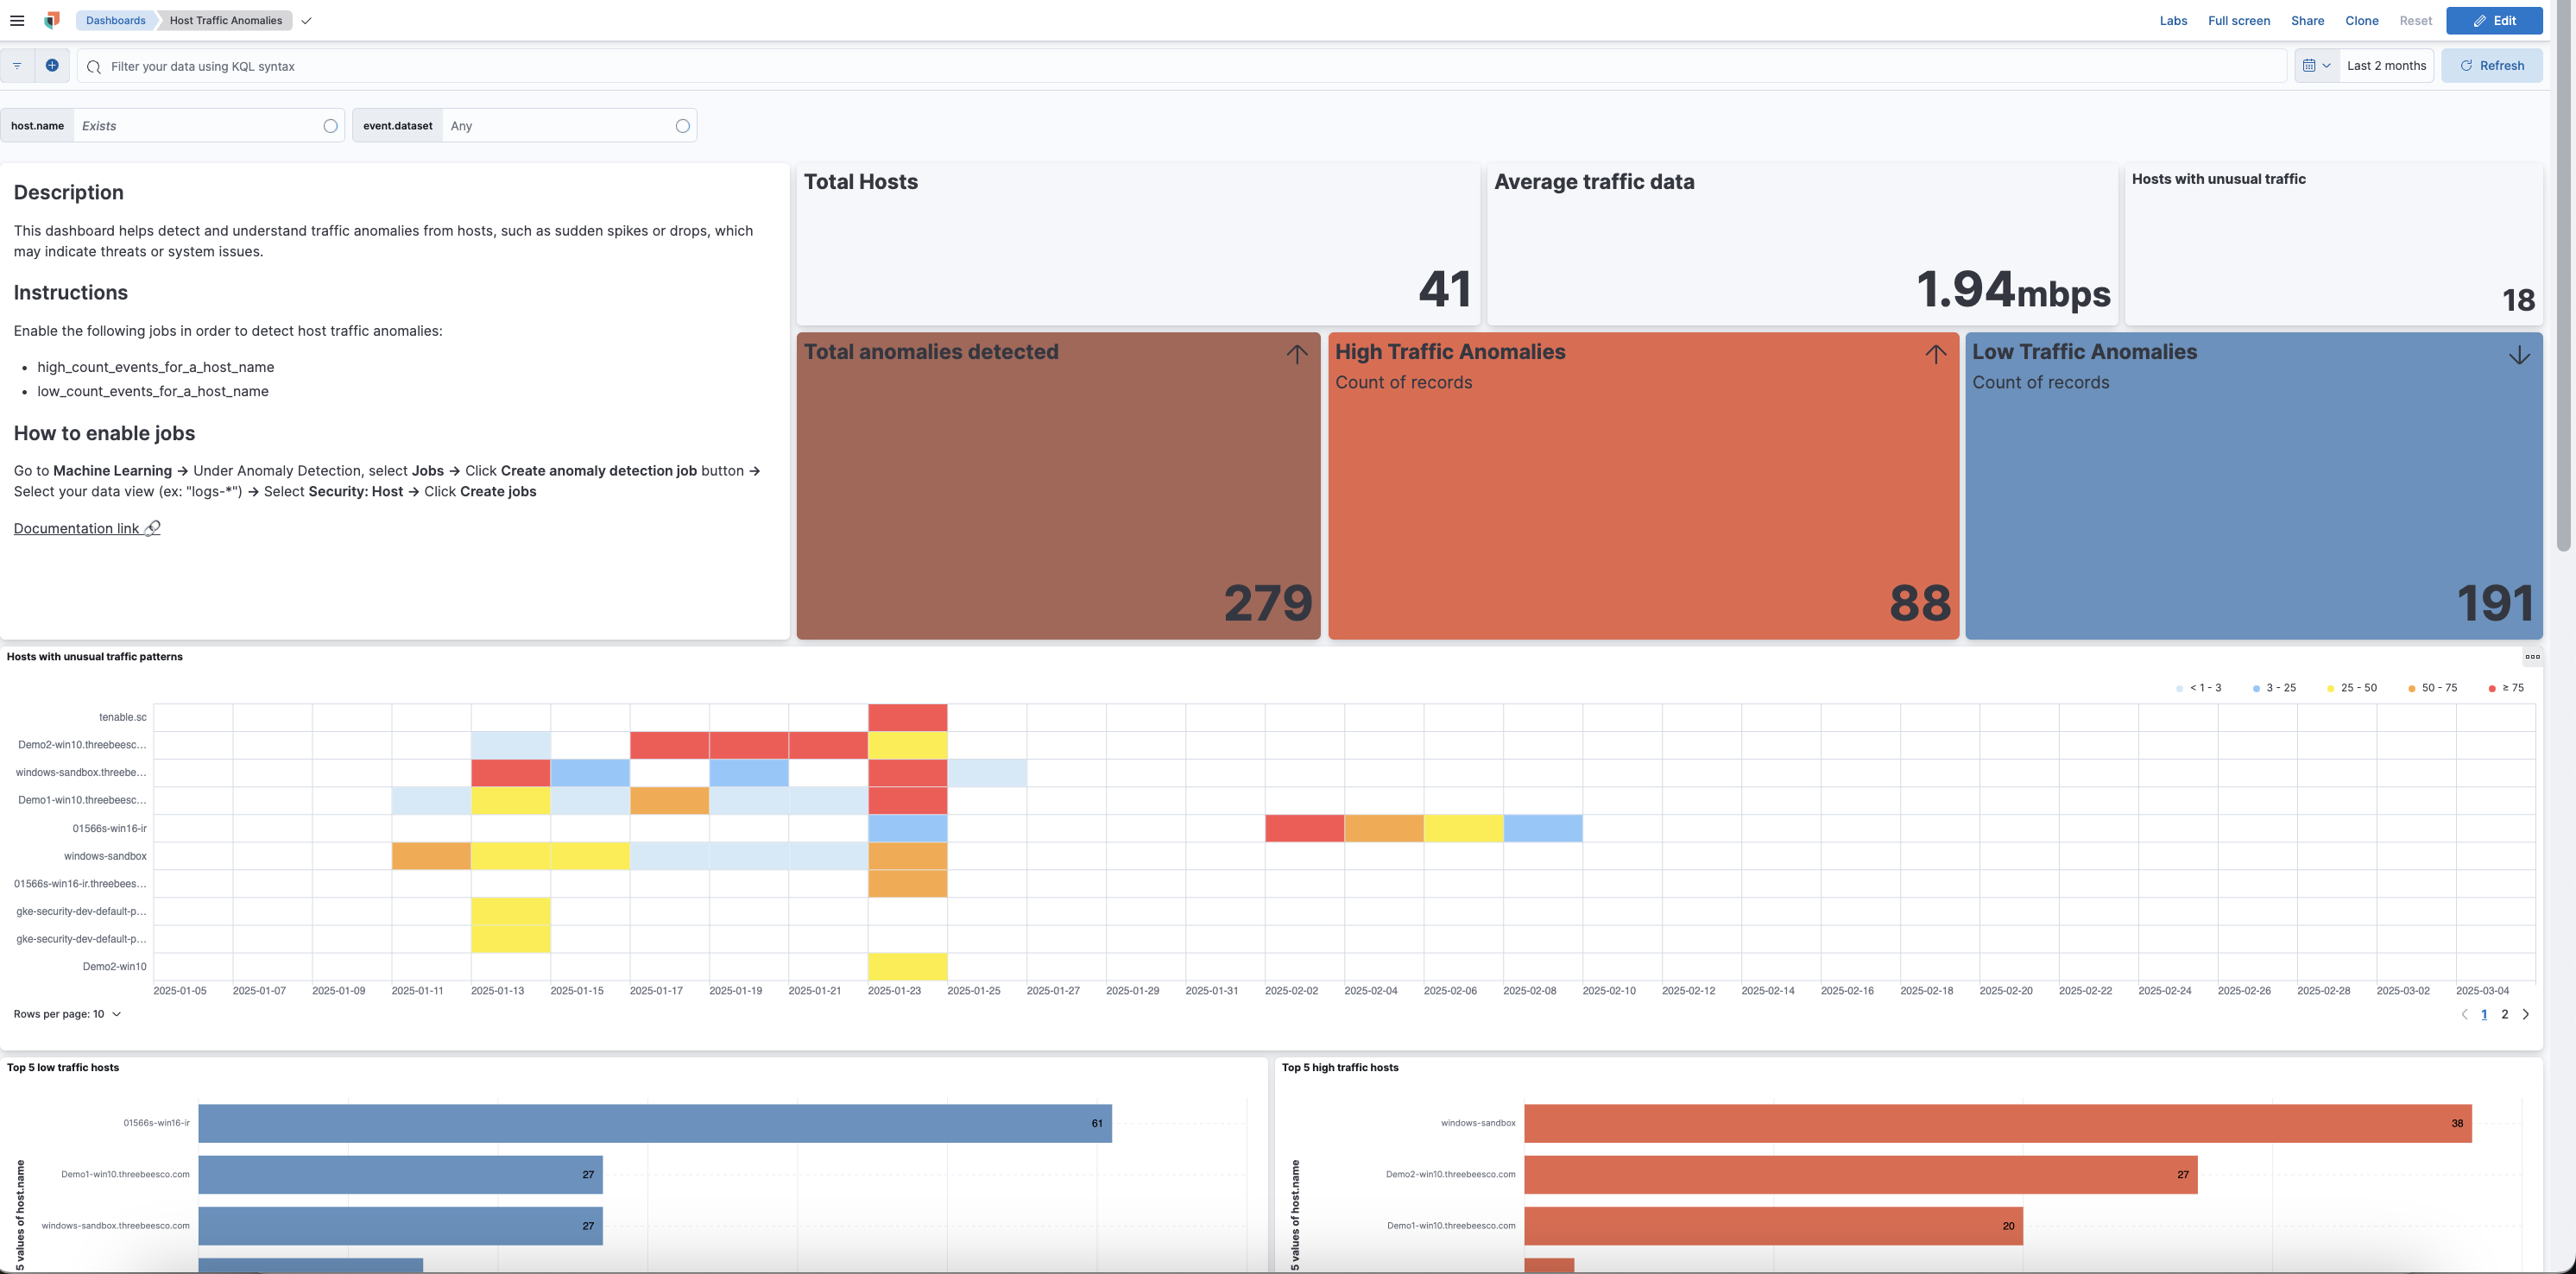
This integration includes one or more Kibana dashboards that visualizes the data collected by the integration. The screenshots below illustrate how the ingested data is displayed.
## Changelog
| Version | Details | Minimum Kibana version |
|-----------|------------------------------------------------------------------------------------------------------------------------------------------------------------------------------------------------------------------|------------------------|
| **2.0.1** | **Enhancement** ([View pull request](https://github.com/elastic/integrations/pull/20662))Update package owner to threat-research-and-detection-engineering team. | 9.4.0 |
| **2.0.0** | **Enhancement** ([View pull request](https://github.com/elastic/integrations/pull/17626))Adds new fields for entity resolution with Entity Analytics in Elastic Stack 9.4. Includes new ML jobs and a dashboard. | 9.4.0 |
| **1.0.2** | **Bug fix** ([View pull request](https://github.com/elastic/integrations/pull/17933))Update documentation for data views | 9.0.08.18.0 |
| **1.0.1** | **Enhancement** ([View pull request](https://github.com/elastic/integrations/pull/15294))Update documentation on configuring data view for dashboards | 9.0.08.18.0 |
| **1.0.0** | **Enhancement** ([View pull request](https://github.com/elastic/integrations/pull/13001))Initial release of the package | 9.0.08.18.0 |