---
title: Use ES|QL in Kibana
description: Learn how to use the ES|QL editor and its syntax help, KQL search, and AI-assisted capabilities to write ES|QL queries across Kibana, including Discover, dashboards, and alerting rules.
url: https://www.elastic.co/docs/explore-analyze/query-filter/languages/esql-kibana
products:
- Elastic Documentation
- Elasticsearch
applies_to:
- Elastic Cloud Serverless: Generally available
- Elastic Stack: Generally available
---
# Use ES|QL in Kibana
Use the ES|QL editor to query and aggregate your data across Kibana, including in [Discover](https://www.elastic.co/docs/explore-analyze/discover/use-esql), on [dashboards](https://www.elastic.co/docs/explore-analyze/visualize/esorql), and in [Elasticsearch query rules](https://www.elastic.co/docs/explore-analyze/alerting/alerts/rule-type-es-query) for alerting. The editor works in many areas, and some tools are available only in **Discover**. To see every area and the editor it uses, refer to [Use ES|QL in Kibana > Use ES|QL across Kibana](#esql-kibana-areas).
As you write a query, the editor offers inline suggestions and syntax help, so you don't have to leave Kibana to check the syntax. You can also filter by time, add variables that make a query interactive, and reuse your recent and starred queries. This page describes these capabilities.
To look up commands, functions, and operators, refer to the [ES|QL reference](https://docs-demo.elastic.dev/docs/reference/query-languages/esql/esql-syntax-reference).
A skill is available to help AI agents with this topic.
## Use ES|QL across Kibana
Editor support varies by area. Some areas use the ES|QL editor described on this page, while others provide a task-specific editor or embed ES|QL in their own editor.
| Area | What you can do | Editing experience |
|-------------------------------------------------------------------------------------------------------------------------------------------------------------------------------------------------------------------------------------------------------|--------------------------------------------------------------------------------------------------------------------------------------------------------------------------------------------------------------------------------------------------------------------------------|--------------------------------------|
| [Discover](https://www.elastic.co/docs/explore-analyze/discover/use-esql) | Explore data, visualize results, and save findings to dashboards | ES|QL editor |
| [Dashboards and visualizations](https://www.elastic.co/docs/explore-analyze/visualize/esorql) | Create visualization panels and interactive controls | ES|QL editor |
| [Alerting](https://www.elastic.co/docs/explore-analyze/alerting/alerts/rule-type-es-query) | Create alerting rules based on ES|QL queries | ES|QL editor |
| [Kibana Universal Alerting](https://www.elastic.co/docs/explore-analyze/alerting/esql/system-overview) Elastic Cloud Serverless: Generally available Elastic Stack: Planned | Build and preview rules with separate base, alert, and recovery queries | Task-specific editor and YAML editor |
| [Maps](https://www.elastic.co/docs/explore-analyze/visualize/maps) Elastic Cloud Serverless: Beta Elastic Stack: Beta | Create map layers from ES|QL queries | ES|QL editor |
| [Data Visualizer](https://www.elastic.co/docs/explore-analyze/machine-learning/machine-learning-in-kibana) | Explore field statistics from query results | ES|QL editor |
| [Elastic Agent Builder](https://www.elastic.co/docs/explore-analyze/ai-features/agent-builder/tools/esql-tools) | Create custom tools that run parameterized queries | Task-specific editor |
| [Streams](https://www.elastic.co/docs/solutions/observability/streams/streams) Elastic Cloud Serverless: Preview Elastic Stack: Preview since 9.4 | Define query streams | Task-specific editor |
| [Elastic Observability solution](https://www.elastic.co/docs/solutions/observability) | Explore [logs](https://www.elastic.co/docs/solutions/observability/logs/discover-logs), [traces](https://www.elastic.co/docs/solutions/observability/apm/discover-traces), and [metrics](https://www.elastic.co/docs/solutions/observability/infra-and-hosts/discover-metrics) | ES|QL editor |
| [Elastic Security solution](https://www.elastic.co/docs/solutions/security/esql-for-security) | Hunt threats, create detection rules, and investigate events | ES|QL editor |
| [Dev Tools Console](https://www.elastic.co/docs/explore-analyze/query-filter/tools/console) | Run queries through the [ES|QL REST API](https://docs-demo.elastic.dev/docs/reference/query-languages/esql/esql-rest) | Embedded in the Console editor |
| [Workflows](https://www.elastic.co/docs/explore-analyze/workflows/steps/elasticsearch) | Run queries with the `elasticsearch.esql.query` action | Embedded in the YAML editor |
| [Vega visualizations](/docs/explore-analyze/visualize/custom-visualizations-with-vega#vega-esql-queries) Elastic Cloud Serverless: Generally available Elastic Stack: Generally available since 9.4 | Use a query as a visualization data source | Embedded in the specification editor |
## Write queries with the ES|QL editor
### Query structure
After any [`SET` statements](#esql-kibana-set), every ES|QL query starts with a [source command](https://docs-demo.elastic.dev/docs/reference/query-languages/esql/commands/source-commands#esql-source-commands) that retrieves data:
- [`FROM`](https://docs-demo.elastic.dev/docs/reference/query-languages/esql/commands/from) allows you to define the data sources to query by specifying data streams, [ES|QL views](https://docs-demo.elastic.dev/docs/reference/query-languages/esql/esql-views), indices, or aliases.
- [`TS`](https://docs-demo.elastic.dev/docs/reference/query-languages/esql/commands/ts) is optimized for querying time series data streams.
- Elastic Cloud Serverless: Generally available Elastic Stack: Generally available since 9.5, Elastic Stack: Preview in 9.4 [`PROMQL`](https://docs-demo.elastic.dev/docs/reference/query-languages/esql/commands/promql) queries time series data through the ES|QL editor using [Prometheus Query Language (PromQL)](https://prometheus.io/docs/prometheus/latest/querying/basics/) syntax.
You can then chain one or more [processing commands](https://docs-demo.elastic.dev/docs/reference/query-languages/esql/commands/processing-commands) using pipe (`|`) characters. For example, [`WHERE`](https://docs-demo.elastic.dev/docs/reference/query-languages/esql/commands/where) filters rows and [`STATS`](https://docs-demo.elastic.dev/docs/reference/query-languages/esql/commands/stats-by) aggregates data:
```esql
FROM kibana_sample_data_logs
| WHERE response.keyword == "200"
| STATS total_bytes = SUM(bytes) BY geo.dest
```
When querying many indices at once without filters, the response might be too large. If you encounter a content length error, use [`DROP`](https://docs-demo.elastic.dev/docs/reference/query-languages/esql/commands/drop) or [`KEEP`](https://docs-demo.elastic.dev/docs/reference/query-languages/esql/commands/keep) to limit the number of fields returned.
ES|QL keywords are case-insensitive. `FROM`, `from`, and `From` are all equivalent.
### Editor tools
The ES|QL editor includes several built-in tools to help you write queries efficiently:
- [Autocomplete and in-app help](#esql-kibana-autocomplete)
- [Query formatting](#_make_your_query_readable)
- [Warnings](#_warnings)
- [Query statistics](#esql-kibana-query-statistics)
- [Keyboard shortcuts](#esql-kibana-keyboard-shortcuts)
#### Autocomplete and in-app help
ES|QL features in-app help, inline suggestions, and an autocomplete menu so you can get started faster and don't have to leave the application to check syntax.
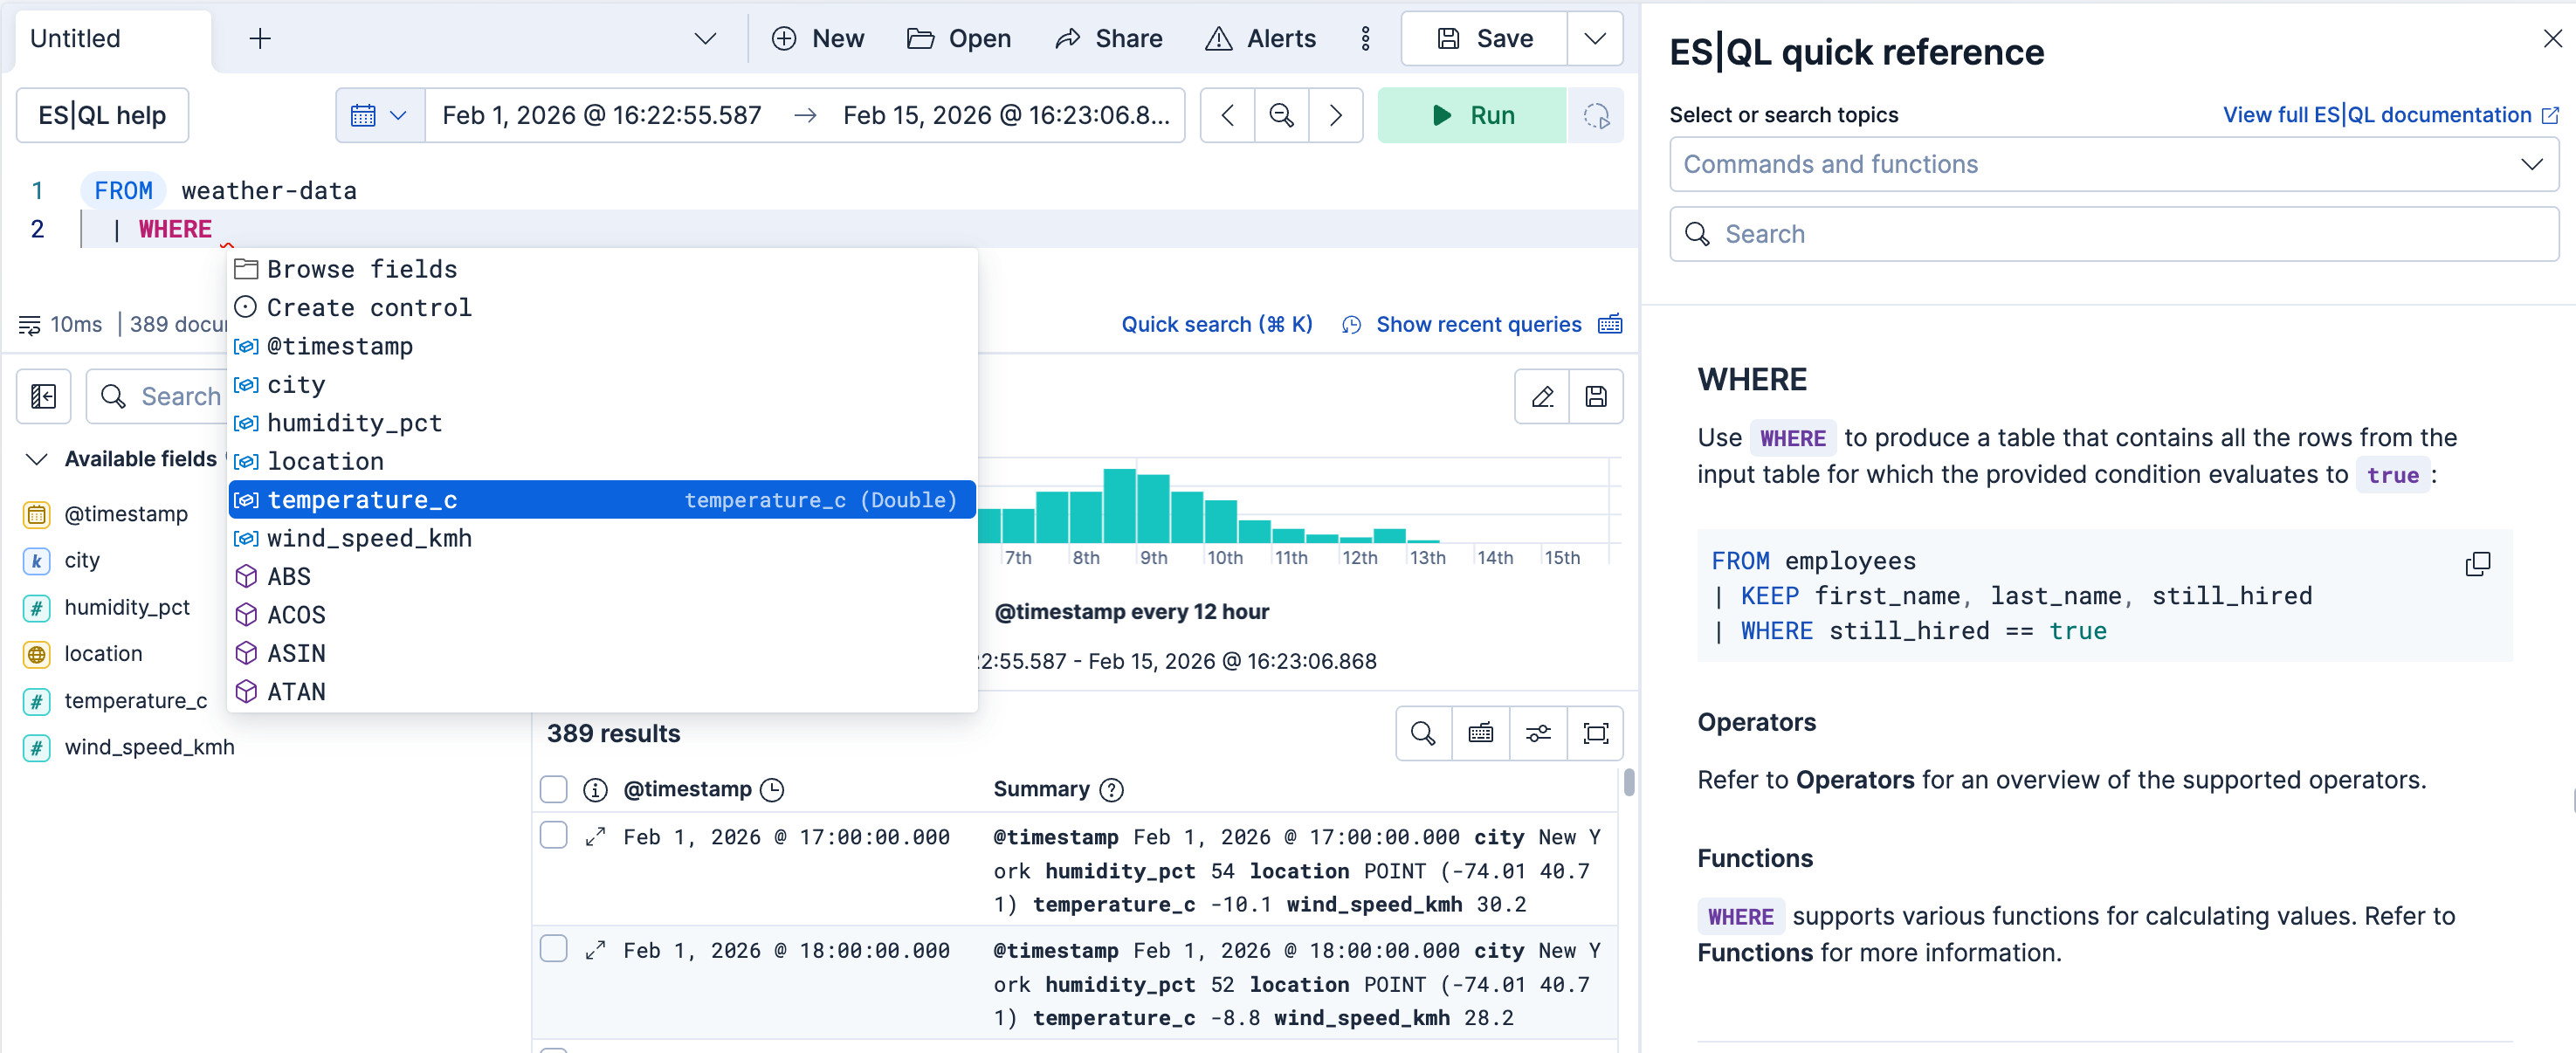
Elastic Cloud Serverless: Generally available Elastic Stack: Generally available since 9.4 In **Discover**, the editor includes interactive browsers for selecting data sources and field names from the autocomplete menu. Refer to [Browse data sources and fields from the ES|QL editor in Discover](https://www.elastic.co/docs/explore-analyze/discover/browse-esql-sources) for details.
#### Query formatting
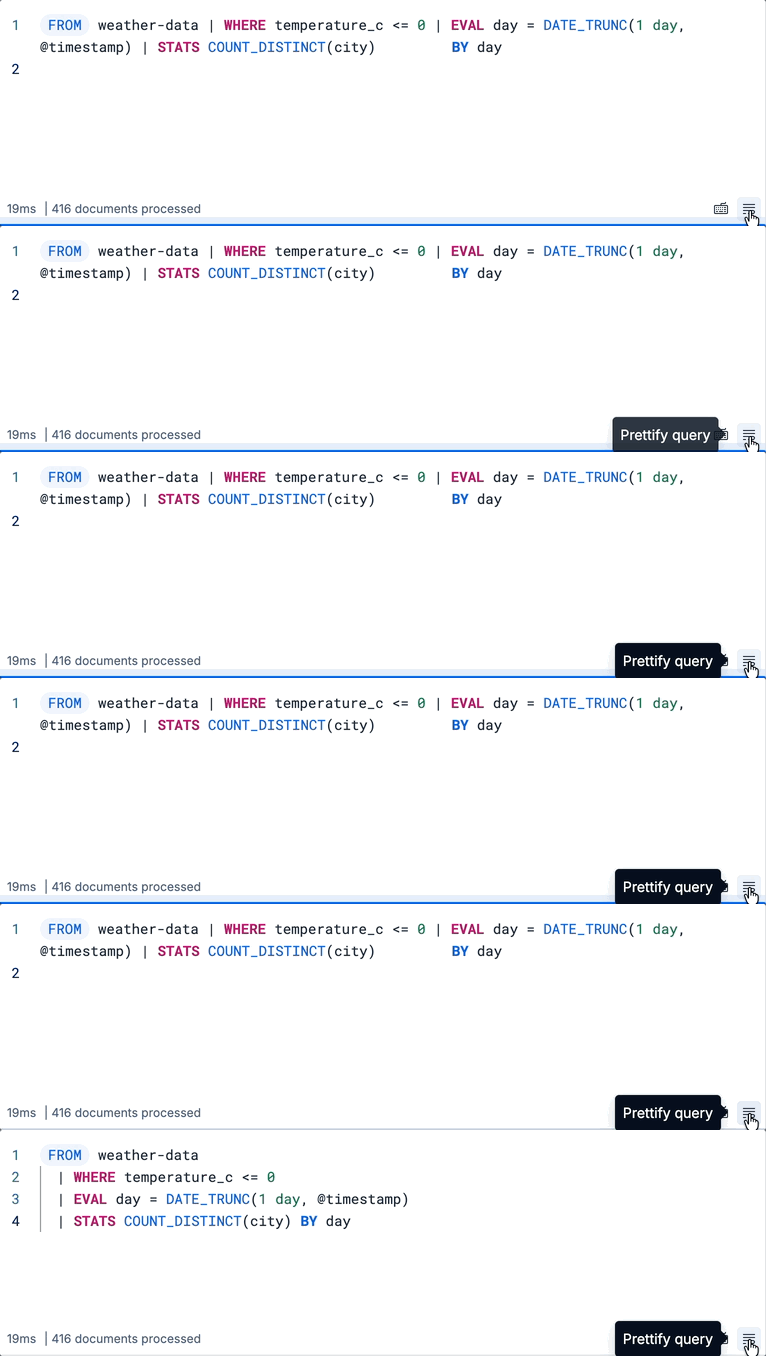
For readability, you can put each processing command on a new line and add indentation. Use the `line_break` **Prettify query** button from the query editor's footer to format your query automatically. You can also adjust the editor's height by dragging its bottom border.
#### Warnings
A query might result in warnings, for example when querying an unsupported field type. When that happens, the editor's footer shows the number of warnings, for example **2 warnings**. Select it to see the detailed warnings.
#### Query statistics
- Elastic Cloud Serverless: Generally available
- Elastic Stack: Generally available since 9.4
After running a query, the editor's footer displays statistics about the last run, including the number of documents processed. These statistics are available in **Discover** and in **ES|QL visualizations** in dashboards.
#### Keyboard shortcuts
| Mac | Windows/Linux | Description | Shortcut availability |
|-----------------------------------|------------------------------------|---------------------------------------------------------------|----------------------------------------------------------------------------------------------------------------------------------------------|
| Cmd + Enter | Ctrl + Enter | Run a query | |
| Cmd + / | Ctrl + / | Comment or uncomment the current line or selected lines | |
| Cmd + i | Ctrl + i | [Prettify query](#_make_your_query_readable) | Elastic Cloud Serverless: Generally available Elastic Stack: Generally available since 9.4 |
| Cmd + j | Ctrl + j | [Generate ES|QL from a `//` comment](#esql-kibana-ai-comment) | Elastic Cloud Serverless: Preview Elastic Stack: Preview since 9.5 |
You can find the list of shortcuts directly from the editor. Look for the  icon.
### Build ES|QL queries from KQL syntax
- Elastic Cloud Serverless: Preview
- Elastic Stack: Preview since 9.3
The ES|QL editor includes a search bar that builds a query from text you enter, so you can filter data without writing the full ES|QL syntax. How you open it depends on your version:
- Elastic Cloud Serverless: Preview Elastic Stack: Planned In **Discover** and on dashboards, the search bar is always visible. When you edit a visualization, a map layer, or an alerting rule, the search icon is in the editor footer.
- Elastic Stack: Preview from 9.3 to 9.5 Look for the search icon in the editor, which is `magnify`, or `magnify_sparkles` when your license includes [AI features](#esql-kibana-ai-assistance). You can also press Cmd + k (Mac) or Ctrl + k (Windows/Linux).
The search bar offers two modes:
- **KQL**: Filter your data with free text or [KQL](https://docs-demo.elastic.dev/docs/reference/query-languages/kql) syntax, as described in this section.
- Elastic Cloud Serverless: Preview Elastic Stack: Preview since 9.5 **Natural language**: Describe the query you want in plain language and let an AI agent generate it for you. Refer to [Generate a full query from natural language](#esql-kibana-quick-search-nl).
To filter your data with KQL:
1. If the search bar isn't visible, open it (`magnify` or `magnify_sparkles`).
2. Set the data sources to search:
- Elastic Cloud Serverless: Preview Elastic Stack: Planned Make sure the query in the editor names the data sources, for example `FROM logs-*`. Until the query names a data source, KQL search isn't available.
- Elastic Stack: Preview from 9.3 to 9.5 Select the data sources to search. The list starts with the data sources named in the editor.
3. Enter the text you want to search for as free text or using [KQL](https://docs-demo.elastic.dev/docs/reference/query-languages/kql) syntax.
4. Submit your search by pressing Enter. The editor replaces the query with a source command for those data sources and a `WHERE KQL()` command that contains the text you entered. The source command is `TS` if the query in the editor starts with `TS`, otherwise `FROM`. Because the editor replaces the whole query, any other commands in it, such as `KEEP`, are removed. The new query is saved to your [query history](#esql-kibana-query-history) so you can restore it later.
5. Refine your query with any other ES|QL command or function that you need.
### Write and fix queries with AI
- Elastic Cloud Serverless: Preview
- Elastic Stack: Preview since 9.5
When your deployment or project has a configured large language model (LLM), Kibana can use AI to help you author ES|QL. The editor uses the model assigned to Elastic Agent Builder's **Fast models** feature, and falls back to the **Global model** setting if no fast model is assigned. Both accept an inference endpoint or a Generative AI connector. To view or change them, search for **Model management / Feature settings** in the [global search field](https://www.elastic.co/docs/explore-analyze/find-and-organize/find-apps-and-objects). You don't need to configure a specific connection for the editor.
Choose the entry point that matches what you want to do:
- [**Generate a full query from natural language**](#esql-kibana-quick-search-nl) in the editor's search bar, when you're starting from scratch or want to replace the whole query.
- [**Generate ES|QL from a comment**](#esql-kibana-ai-comment) to add or change a single pipe inside the query you're writing.
- [**Fix query errors with AI**](#esql-kibana-ai-fix) when a query fails validation.
**Requirements**
- For Elastic Cloud Hosted, Elastic Cloud Enterprise, and Elastic Cloud on Kubernetes deployments or self-managed clusters, you need an Enterprise license.
- A configured LLM. Refer to [Configure access to LLMs](https://www.elastic.co/docs/explore-analyze/ai-features/llm-guides/llm-connectors).
Without an Enterprise license, the AI prompts and actions don't appear, and the editor uses only its standard autocomplete behavior. With a license but no configured model, the comment hints and **Fix with AI** still appear, and using them shows a **No AI connector available.** notification. Natural language mode in the search bar also needs a model. What you see without one depends on your version:
- Elastic Cloud Serverless: Preview Elastic Stack: Planned Natural language mode doesn't appear until you configure a model.
- Elastic Stack: Preview in 9.5 Natural language mode appears, and selecting it shows a link to set up a connector.
Elastic Stack: Planned Elastic Cloud Serverless: Unavailable The AI agent can also use [ES|QL Data Federation datasets](https://docs-demo.elastic.dev/docs/reference/query-languages/esql/esql-data-federation-datasets) as sources. It uses them when it writes a full query, in natural language mode or from a comment when the editor contains only comments, and when you use **Fix with AI**. It uses only the datasets that you have the `read_dataset_metadata`, `manage_dataset`, `manage`, or `all` index privilege on.
#### Generate a full query from natural language
Not sure how to write an ES|QL query? Describe what you want from your data in natural language and a specialized AI agent writes the query for you.
1. If the search bar isn't visible, open it (`magnify_sparkles`).
2. From the mode selector, select **Natural language**.
3. In the input, describe the query you want. For example, `Show the average response time per host for the last 24 hours`.
4. Press **Enter** to submit your request. The editor replaces or updates the current query, runs it, and saves it to your [query history](#esql-kibana-query-history).
5. Review the generated query and refine it with any other ES|QL command or function that you need.
The current query in the editor is sent to the LLM as context, so you can ask follow-up requests that build on it. For example, after running a generated query, ask `Group the results by region` to extend it.

#### Generate ES|QL from a comment
Write a `//` comment that describes what you want, then press Cmd + j (Mac) or Ctrl + j (Windows/Linux). The editor sends your comment to the AI agent and inserts the generated ES|QL on the next line.
You can use this to:
- Write a query from scratch when the editor is empty. For example, type `// Show the top 10 destinations by flight count` and press Cmd + j to generate a complete query.
- Add a step to an existing query. Place the comment between pipes (for example `// filter for delayed flights`) and the AI agent generates a single pipe to append. If the AI agent determines that your comment describes a change to the next pipe rather than a new step, it modifies that pipe instead.
While the AI agent is generating, a `Generating...` indicator appears next to your comment. Press the shortcut again to cancel the in-flight request and start a new one.
When the generated code is ready, the editor highlights it and shows review actions:
- **Keep** (Cmd + Shift + Enter on Mac, Ctrl + Shift + Enter on Windows/Linux) accepts the change and leaves your comment in place so you can refine it and regenerate.
- **Undo** (Cmd + Shift + Backspace on Mac, Ctrl + Shift + Backspace on Windows/Linux) removes the generated code.

When the AI agent rewrites an existing pipe instead of adding one, the original pipe appears with a strikethrough and the **Keep** button becomes **Replace**, indicating that accepting the suggestion removes the original pipe.
#### Fix query errors with AI
When your query fails validation, hover over the underlined error in the editor. The error popup includes a **✨ Fix with AI** link. Select it to send the query and the error to the AI agent and have it propose a corrected version.

The proposed fix appears directly below your query, with the original lines and the suggested replacement highlighted in different colors. The same review actions as for comment-driven generation apply:
- **Replace** (Cmd + Shift + Enter on Mac, Ctrl + Shift + Enter on Windows/Linux) replaces the original lines with the suggested fix.
- **Undo** (Cmd + Shift + Backspace on Mac, Ctrl + Shift + Backspace on Windows/Linux) discards the suggestion and restores the original query.

After you run a query in **Discover**, an AI agent can also analyze the results, render a chart of the main finding, and suggest drill-down queries. Refer to [Analyze your data with AI](https://www.elastic.co/docs/explore-analyze/discover/analyze-discover-data-with-ai).
### Commands with additional editor support
Some ES|QL commands have dedicated editor features beyond autocomplete, such as in-editor index or policy creation.
#### LOOKUP JOIN command and lookup indices
The ES|QL editor supports [`LOOKUP JOIN`](https://docs-demo.elastic.dev/docs/reference/query-languages/esql/commands/lookup-join) commands and suggests lookup mode indices and join condition fields.
In **Discover**, `LOOKUP JOIN` commands let you create or edit lookup indices directly from the editor. Find more information in [Create lookup indices from Discover queries](https://www.elastic.co/docs/explore-analyze/discover/create-lookup-indices).
#### Cross-cluster and cross-project lookup joins
- Elastic Cloud Serverless: Generally available
- Elastic Stack: Generally available since 9.2
Remote lookup joins are supported in [cross-cluster](https://docs-demo.elastic.dev/docs/reference/query-languages/esql/esql-cross-clusters) and [cross-project](https://docs-demo.elastic.dev/docs/reference/query-languages/esql/esql-cross-serverless-projects) queries. By default, ES|QL resolves the lookup index on every remote cluster or project in the query, and each one joins against its own local index with that name.
Elastic Cloud Serverless: Preview Elastic Stack: Planned To join against a lookup index on the local cluster or origin project when that index is missing from one or more clusters or projects in the query, use [`LOOKUP JOIN` coordinator mode](https://docs-demo.elastic.dev/docs/reference/query-languages/esql/esql-lookup-join#coordinator-mode).
#### ENRICH command and enrich policies
The ES|QL [`ENRICH`](https://docs-demo.elastic.dev/docs/reference/query-languages/esql/commands/enrich) command enables you to [enrich](https://docs-demo.elastic.dev/docs/reference/query-languages/esql/esql-enrich-data) your query dataset with fields from another dataset. Before you can use `ENRICH`, you need to [create and execute an enrich policy](https://docs-demo.elastic.dev/docs/reference/query-languages/esql/esql-enrich-data#esql-set-up-enrich-policy). If a policy exists, autocomplete suggests it. If not, select **Click to create** to create one.

For detailed steps to create an enrich policy from the editor, refer to [Enrich your data](https://docs-demo.elastic.dev/docs/reference/query-languages/esql/esql-enrich-data).
## Filter by time
To display data within a specified time range, you can use the standard time filter, custom time parameters, or a WHERE command.
### Standard time filter
Kibana enables the standard [time filter](https://www.elastic.co/docs/explore-analyze/query-filter/filtering) when the indices you're querying have a field named `@timestamp`.
### Custom time parameters
If your indices do not have a field named `@timestamp`, you can use the `?_tstart` and `?_tend` parameters to specify a time range. These parameters work with any timestamp field and automatically sync with the [time filter](https://www.elastic.co/docs/explore-analyze/query-filter/filtering).
```esql
FROM my_index
| WHERE custom_timestamp >= ?_tstart AND custom_timestamp < ?_tend
```
You can also use the `?_tstart` and `?_tend` parameters with the [`BUCKET`](https://docs-demo.elastic.dev/docs/reference/query-languages/esql/functions-operators/grouping-functions/bucket) function to create auto-incrementing time buckets in ES|QL visualizations. For example:
```esql
FROM kibana_sample_data_logs
| STATS average_bytes = AVG(bytes) BY BUCKET(@timestamp, 50, ?_tstart, ?_tend)
```
### Time ranges with WHERE
You can also limit the time range using the [`WHERE`](https://docs-demo.elastic.dev/docs/reference/query-languages/esql/commands/where) command and the [`NOW`](https://docs-demo.elastic.dev/docs/reference/query-languages/esql/functions-operators/date-time-functions/now) function. For example, if the timestamp field is called `timestamp`, to query the last 15 minutes of data:
```esql
FROM kibana_sample_data_logs
| WHERE timestamp > NOW() - 15minutes
```
To apply a time shift in an ES|QL visualization, refer to [Compare current versus previous period with time shift](/docs/explore-analyze/visualize/esorql#esql-viz-time-shift).
### Timezone handling
- Elastic Cloud Serverless: Generally available
- Elastic Stack: Generally available since 9.4
ES|QL queries use a timezone for date and time functions and time-based filtering. When you run ES|QL queries in Discover, dashboards, or Maps, Kibana automatically uses the timezone from the **Time zone** (`dateFormat:tz`) [advanced setting](https://docs-demo.elastic.dev/docs/reference/kibana/advanced-settings). To change it:
1. Go to **Stack Management** → **Advanced Settings** (or **Management** → **Advanced Settings** in Serverless).
2. Search for **Time zone** (`dateFormat:tz`).
3. Set it to **Browser** to use your browser's timezone, or choose a specific timezone such as **UTC** or **America/New_York**.
Avoid `SET time_zone` in **Discover**, dashboards, and **Maps**. `SET time_zone` changes how dates are computed by Elasticsearch, but Kibana still displays timestamps following the timezone defined in its `dateFormat:tz` advanced setting, which can produce confusing results.
Elasticsearch query rules that use ES|QL don't use the **Time zone** setting. They run in UTC unless the rule query or the cluster sets a timezone. To control the timezone for a rule, refer to [Set the timezone for an ES|QL query](/docs/explore-analyze/alerting/alerts/rule-type-es-query#rule-type-es-query-esql-timezone).
## Use variables and controls
ES|QL variables help you add interactive controls to your queries and make them more dynamic.
They're available for:
- Elastic Cloud Serverless: Preview Elastic Stack: Preview since 9.2 [Discover queries](https://www.elastic.co/docs/explore-analyze/discover/esql-variable-controls)
- [ES|QL visualizations in dashboards](https://www.elastic.co/docs/explore-analyze/visualize/add-variable-controls)
1. While you edit your ES|QL query, the autocomplete menu suggests adding a control when relevant or when you type `?` in the query. Select **Create control**.
2. A flyout opens to let you configure the control. Specify:
- The type of the control:
- For controls with **Static values**, enter available values manually or select them from the dropdown list.
- For controls with **Values from a query**, write an ES|QL query that returns a single column to populate the list of options. Use this option to dynamically retrieve control values or to set up [chained controls](/docs/explore-analyze/visualize/add-variable-controls#chain-variable-controls). This type is available only for controls that replace values, such as a host name or a number. Controls that replace field names, function names, or time intervals use **Static values**.
To restrict the options to values that exist within the selected time range, add `WHERE @timestamp <= ?_tend AND @timestamp > ?_tstart` to the control's query. If your indices don't have a `@timestamp` field, replace `@timestamp` with your time field, as described in [custom time parameters](#_custom_time_parameters).
- The name of the control. You use this name to reference the control in ES|QL queries. You can't change the name after you save the control, so the prefix is also fixed. The prefix tells ES|QL what the control inserts into the query:
- Start the name with `?` when the options are values, such as a host name, a number, or a time interval. The control inserts the value you select.
- Elastic Cloud Serverless: Preview Elastic Stack: Preview since 9.1 Start the name with `??` when the options are field names or function names. The control inserts the name you select.
- The values users can select. You can add multiple values from suggested fields or type in custom values. If you selected **Values from a query**, write an ES|QL query instead.
- The label of the control. This is the label displayed in **Discover** or in the dashboard.
- Elastic Cloud Serverless: Preview Elastic Stack: Preview since 9.3 Whether the control allows a single selection or multiple selections. Multiple selections require using the [`MV_CONTAINS`](#esql-multi-values-controls) function in your query.
- Elastic Cloud Serverless: Preview Elastic Stack: Preview since 9.4 To match any selected value instead of all of them, use `MV_INTERSECTS` instead of `MV_CONTAINS`.
3. Save the control.
The control is created. If you created it while editing a query, its variable is inserted into that query, which you can keep editing.
**Examples**
- Filter by a selected value:
```esql
| WHERE field == ?value
```
- Group by a selected field:
```esql
| STATS count = COUNT(*) BY ??field
```
- Adjust a function setting, such as a date histogram interval:
```esql
| STATS count = COUNT(*) BY BUCKET(@timestamp, ?interval)
```
- Switch the aggregation function:
```esql
| STATS metric = ??function
```
### Multi-value variable controls
- Elastic Cloud Serverless: Preview
- Elastic Stack: Preview since 9.3
You can create controls that let users select multiple values. To do that:
1. Add the [`MV_CONTAINS`](https://docs-demo.elastic.dev/docs/reference/query-languages/esql/functions-operators/mv-functions/mv_contains) function to your query, with the field as the first parameter (superset) and a [variable](#add-variable-control) as the second parameter (subset). For example:
```esql
FROM logs-* | WHERE MV_CONTAINS(field, ?values)
```
Multi-selection is only available for `?values` variables, not for `??fields` or `??functions` variables.[`MV_CONTAINS`](https://docs-demo.elastic.dev/docs/reference/query-languages/esql/functions-operators/mv-functions/mv_contains) checks that _all_ subset values are present.Elastic Cloud Serverless: Preview Elastic Stack: Preview since 9.4 If matching _any_ subset value is enough, use [`MV_INTERSECTS`](https://docs-demo.elastic.dev/docs/reference/query-languages/esql/functions-operators/mv-functions/mv_intersects) instead.
2. When defining the control, select the **Allow multiple selections** option.
3. Save the control.
The newly configured control becomes available and allows users to select multiple values.
## Manage queries
The ES|QL editor keeps track of your queries so you can reuse and organize them.
### Query history
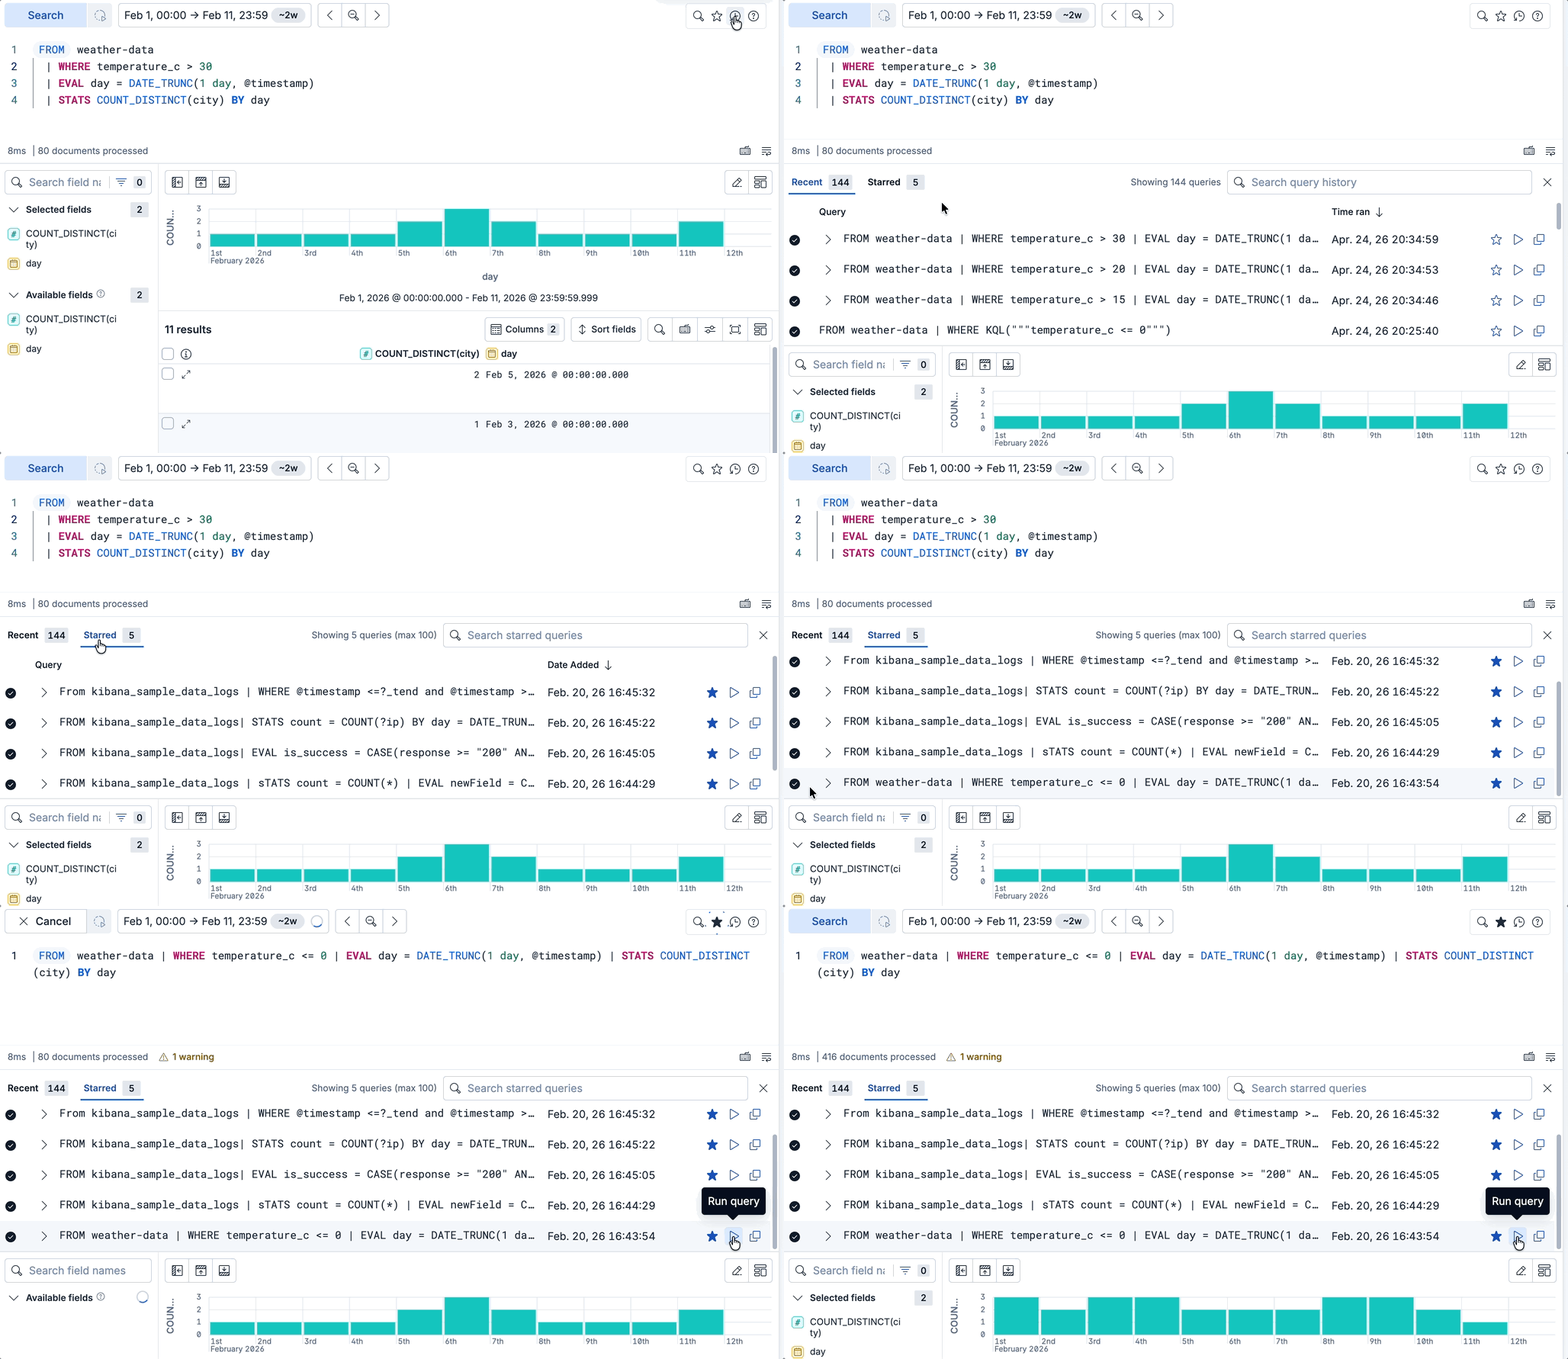
You can reuse your recent ES|QL queries. In the ES|QL editor, select **Show recent queries**.
You can then:
- scroll through your most recent queries
- Elastic Cloud Serverless: Generally available Elastic Stack: Generally available since 9.2 search for specific queries of your history
The maximum number of queries in the history depends on the version you're using:
- Elastic Cloud Serverless: Generally available Elastic Stack: Generally available since 9.2 The query history can keep up to 50 KB of queries, which represents about 200 large queries, or about 300 short queries.
- Elastic Stack: Generally available from 9.0 to 9.1 The query history keeps your 20 most recent queries.
### Starred queries
From the query history, you can mark some queries as favorite to find and access them faster later.
1. In the ES|QL editor, select **Show recent queries**.
2. On the **Recent** tab, star the queries you want.
To find your starred queries later, open the **Starred** tab.
## Create and manage ES|QL views
- Elastic Cloud Serverless: Generally available
- Elastic Stack: Planned
You can use [ES|QL views](https://docs-demo.elastic.dev/docs/reference/query-languages/esql/esql-views) to save queries and reuse them by name in `FROM`, just like an index. In Kibana, you can create views from the ES|QL editor and manage them from the **ES|QL Views** page.
These options appear only if you have the following [privileges](https://docs-demo.elastic.dev/docs/reference/query-languages/esql/esql-views#esql-views-privileges) on all indices (`*`):
- `read_view_metadata` to open the **ES|QL Views** page
- `create_view` to create or edit views
- `delete_view` to delete views
### Create a view from the ES|QL editor
You can create a view from the ES|QL editor in Discover, or when you edit an ES|QL visualization in a dashboard.
1. Open the **Create view** dialog in one of these ways:
- From your [query history](#esql-kibana-query-history):
1. Select **Show recent queries**.
2. On the **Recent** or **Starred** tab, select the `index_open` **Create view** icon on the query's row.
- From the current query: select the `index_open` **Create view** icon in the editor toolbar.

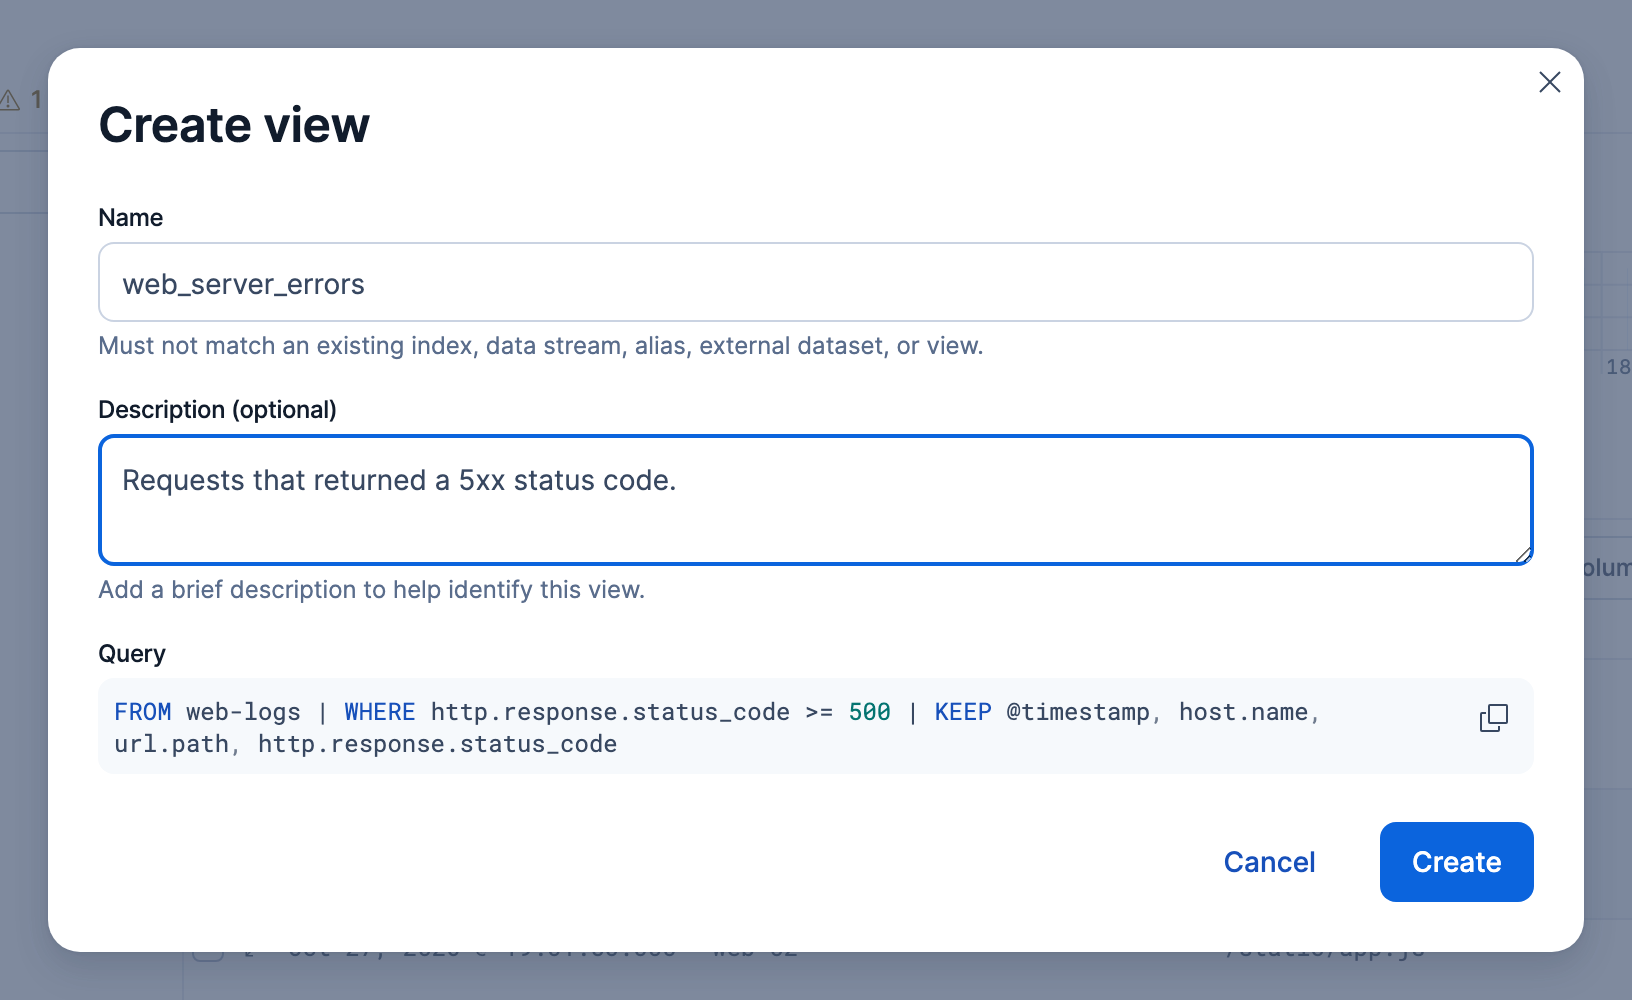
2. Enter a name and an optional description, then select **Create**.
### Manage views
To list, edit, preview, or delete views, go to the **ES|QL Views** management page using the navigation menu or the [global search field](https://www.elastic.co/docs/explore-analyze/find-and-organize/find-apps-and-objects). Each view's row has two actions:
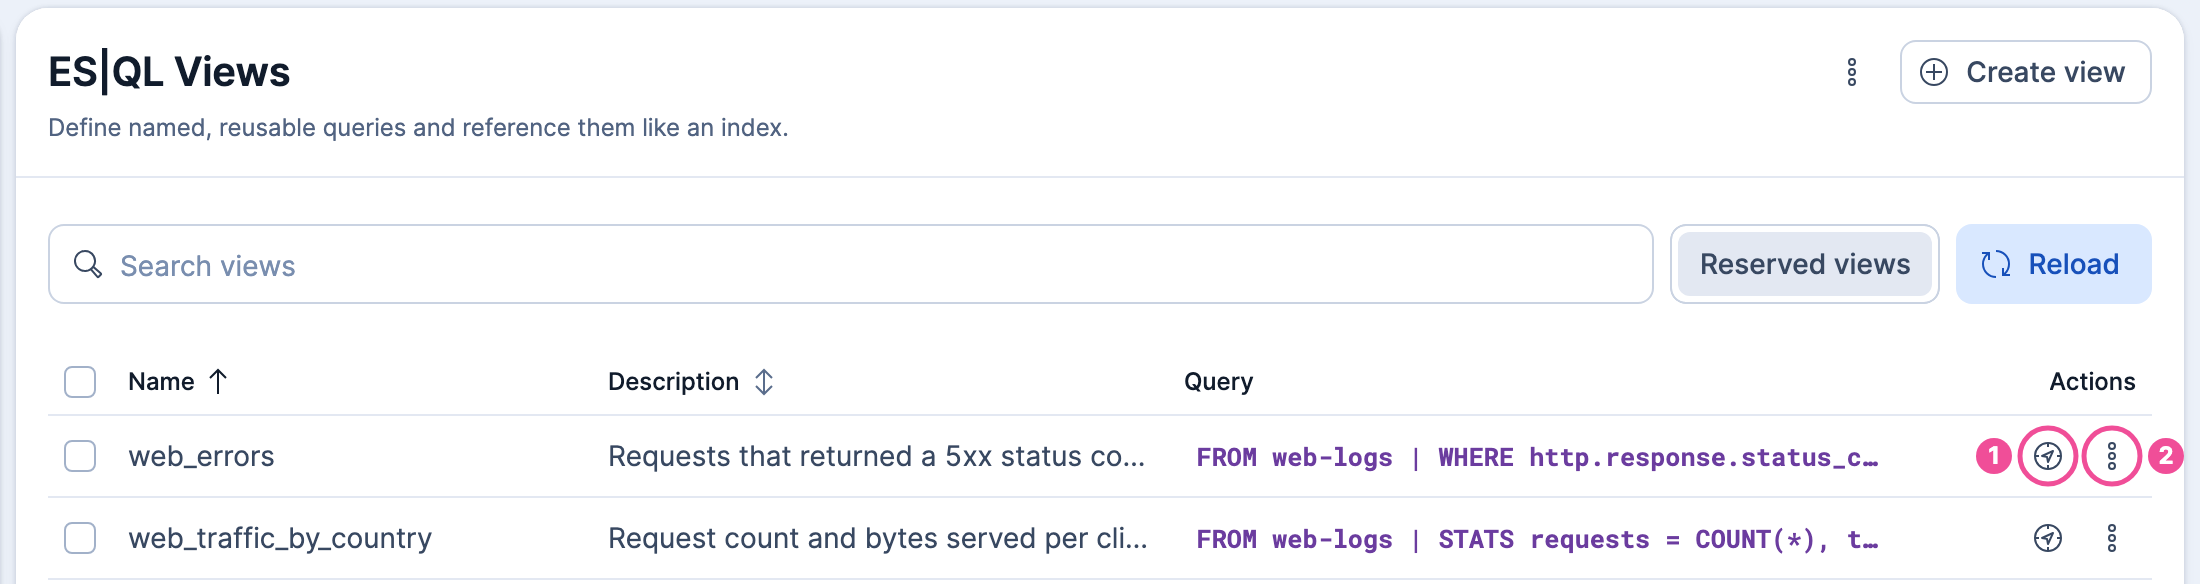
1. `product_discover` **Open in Discover** opens the view in Discover.
2. The `boxes_vertical` actions menu has options to edit or delete the view.
[Reserved views](https://docs-demo.elastic.dev/docs/reference/query-languages/esql/esql-views#esql-views-reserved) are created by Elasticsearch, so they're read-only. They have a **Reserved** badge. To hide them from the list, select the **Reserved views** filter.
## Define query settings with `SET`
- Elastic Cloud Serverless: Generally available
- Elastic Stack: Generally available since 9.4
The [`SET`](https://docs-demo.elastic.dev/docs/reference/query-languages/esql/directives/set) directive lets you configure how Elasticsearch runs your ES|QL query. Place one or more `SET` statements at the start of your query. Each statement sets one setting and ends with a semicolon:
```esql
SET setting_name = setting_value;
SET other_setting_name = other_value;
```
The ES|QL editor autocompletes supported settings and validates their values. Settings particularly useful from Kibana include:
- [`approximation`](#approximation-fast-mode): Trade exact results for speed on large `STATS` queries using random sampling. Several Kibana apps expose this functionality with a [Fast mode](#approximation-fast-mode) UI option.
- [`project_routing`](#esql-kibana-cps): Limit a [cross-project search](https://www.elastic.co/docs/explore-analyze/cross-project-search) to specific projects.
- [`unmapped_fields`](#esql-kibana-unmapped-fields): Choose how to handle fields that are not present in the index mapping.
The `SET` directive also supports a `time_zone` setting. However, to change the timezone used by your ES|QL queries in Kibana, update the `dateFormat:tz` advanced setting rather than using `SET time_zone`. Refer to [Timezone handling](#esql-kibana-timezone) for more information.
For the full list of supported settings and their parameters, refer to the [`SET` directive reference](https://docs-demo.elastic.dev/docs/reference/query-languages/esql/directives/set).
### Search across projects with `SET project_routing`
- Elastic Cloud Serverless: Generally available
- Elastic Stack: Unavailable
When [cross-project search](https://www.elastic.co/docs/explore-analyze/cross-project-search) is enabled and you have [linked projects](https://www.elastic.co/docs/deploy-manage/cross-project-search-config/cps-config-link-and-manage), you can add [`SET project_routing`](https://docs-demo.elastic.dev/docs/reference/query-languages/esql/directives/set) at the beginning of your ES|QL query to [override the cross-project search scope](/docs/explore-analyze/cross-project-search/cross-project-search-manage-scope#cps-in-kibana) and target specific projects:
```esql
SET project_routing = "_alias:my_other_project";
FROM logs-*
| WHERE log.level == "error"
| STATS count = COUNT(*) BY service.name
```
The editor autocompletes two built-in values when you type `SET project_routing`:
- `_alias:_origin`: Search only the current (origin) project.
- `_alias:*`: Search all linked projects.
You can use any valid [project routing expression](https://www.elastic.co/docs/explore-analyze/cross-project-search/cross-project-search-project-routing), including tag-based and named expressions. For more details on query-level overrides, refer to [Managing cross-project search scope](/docs/explore-analyze/cross-project-search/cross-project-search-manage-scope#cps-query-overrides).
### Handle unmapped fields with `SET unmapped_fields`
- Elastic Cloud Serverless: Generally available
- Elastic Stack: Generally available since 9.5
- Elastic Stack: Preview in 9.4
By default, an ES|QL query fails if it references a field that is not present in the mapping of any searched index. Use [`SET unmapped_fields`](https://docs-demo.elastic.dev/docs/reference/query-languages/esql/directives/set#esql-unmapped_fields) at the start of your query to instead treat unmapped fields as `null` (`NULLIFY`) or load them from `_source` as `keyword` (`LOAD`). For example:
```esql
SET unmapped_fields="NULLIFY";
FROM partial_mapping_sample_data
| KEEP event_duration, unmapped_message
| SORT event_duration
| LIMIT 1
```
The ES|QL editor autocompletes the setting name and its accepted values. Once `NULLIFY` or `LOAD` is set, unmapped fields referenced in the query are added to autocomplete and treated like other columns. They stop being suggested if you drop or rename them.
The first time a query references an unmapped field, the editor shows a warning so you can confirm the reference is intentional and not a typo. After a `KEEP` or `STATS` command that limits the available columns, references to unmapped fields downstream are flagged as errors.
`LOAD` doesn't support every command and field type. For example, it doesn't load subfields of `flattened` fields, and it doesn't work with `PROMQL`. For the full list, refer to [Other restrictions](https://docs-demo.elastic.dev/docs/reference/query-languages/esql/esql-unmapped-fields#esql-unmapped-fields-other-restrictions). Two more details depend on your version:
- Elastic Cloud Serverless: Preview Elastic Stack: Preview since 9.5 When querying a [wired stream](/docs/solutions/observability/streams/get-data-in#get-data-in-wired) and the editor detects an unknown column error, a **Load unmapped fields** quick fix is available. Select it to apply `SET unmapped_fields = "LOAD";` automatically. Refer to [Query unmapped fields](/docs/solutions/observability/streams/get-data-in#streams-wired-streams-discover-unmapped) for wired stream–specific details.
- Elastic Stack: Preview in 9.4 `LOAD` doesn't work in queries that use `FORK`, `LOOKUP JOIN`, subqueries, views, or full-text search functions. When querying multiple indices, fields that have a non-keyword type in some indices but are unmapped in others need an explicit cast (for example, `my_field::integer` or `TO_INTEGER(my_field)`) unless referenced in a `KEEP` or `DROP` command.
For a conceptual overview and use cases, refer to [Unmapped fields](https://docs-demo.elastic.dev/docs/reference/query-languages/esql/esql-unmapped-fields).
## Get faster results with approximate `STATS`
- Elastic Cloud Serverless: Preview
- Elastic Stack: Preview since 9.4
For Elastic Cloud Hosted, Elastic Cloud Enterprise, and Elastic Cloud on Kubernetes deployments or self-managed clusters, approximation requires an [Enterprise subscription](https://www.elastic.co/subscriptions).
On large datasets, you can trade exact results for speed by enabling [approximate results](https://docs-demo.elastic.dev/docs/reference/query-languages/esql/esql-query-approximation) for [`STATS`](https://docs-demo.elastic.dev/docs/reference/query-languages/esql/commands/stats-by) queries. Approximation runs your `STATS` aggregations on a sample of the data and extrapolates to estimate results for the full dataset, so the numbers come out close to the exact ones. You can enable approximation in two ways:
- Elastic Cloud Serverless: Preview, Elastic Stack: Preview since 9.5 From the Kibana UI, with [Fast mode](#esql-kibana-fast-mode-toggle).
- From within a query, with the [`SET approximation`](#esql-kibana-approximation) directive.
However you enable it, Elasticsearch applies approximation only when it actually speeds up the query. When your data is smaller than the sample size (by default around 1 million rows for `STATS ... BY` queries and 100,000 rows for other `STATS` queries), or a filter has already narrowed the results, Elasticsearch returns exact results instead. Approximation only works with certain aggregations, so functions such as `COUNT_DISTINCT`, `MIN`, `MAX`, and `LAST` always run exactly. Because approximate results are estimates, they can vary between runs and might drop low-frequency groups. For the full conditions and supported functions, refer to [Approximate `STATS` queries](https://docs-demo.elastic.dev/docs/reference/query-languages/esql/esql-query-approximation).
### Use Fast mode
- Elastic Cloud Serverless: Preview
- Elastic Stack: Preview since 9.5
Fast mode is the Kibana UI control for ES|QL approximation. Select the `bolt` **Fast mode** option to turn it on.

Where it applies depends on the context:
- In [**Discover**](https://www.elastic.co/docs/explore-analyze/discover/use-esql), in ES|QL mode, the button is always available, but **Fast mode** applies only to queries that use exactly one `STATS` command.
- In **Dashboards** or when previewing a dashboard created with [Elastic Agent Builder](https://www.elastic.co/docs/explore-analyze/ai-features/agent-builder/agent-builder-dashboards-and-visualizations), `bolt` **Fast mode** can return faster, estimated results for [ES|QL visualizations](https://www.elastic.co/docs/explore-analyze/visualize/esorql), ES|QL-based Discover sessions, [custom panels](https://www.elastic.co/docs/explore-analyze/visualize/custom-panels) that have an ES|QL query, and ES|QL-powered [Vega and Vega-Lite panels](/docs/explore-analyze/visualize/custom-visualizations-with-vega#vega-esql-queries) that use one `STATS` command. You can turn **Fast mode** on when the dashboard includes at least one ES|QL-based panel.
- Elastic Cloud Serverless: Preview Elastic Stack: Planned Turning **Fast mode** on does not change a map with an ES|QL layer. To approximate a `STATS` query on the map, use the [SET approximation directive](#esql-kibana-approximation) in the layer query. The option can still appear when that map is an ES|QL-based panel on the dashboard.
**Fast mode** is preserved when you:
- Save or share a dashboard
- Elastic Cloud Serverless: Preview Elastic Stack: Planned Save and reopen a Discover session. Refer to [Save a Discover session](/docs/explore-analyze/discover/save-open-search#_save_a_discover_session).
To override the toggle for a single query, use the [`SET approximation`](#esql-kibana-approximation) directive.
To tell whether approximation was applied, look for the `bolt` badge in Discover or in the panel header on a dashboard. Refer to [Interpret approximate results](#esql-kibana-approximation-columns).
### Use the `SET approximation` directive
- Elastic Cloud Serverless: Preview
- Elastic Stack: Preview since 9.4
The [`SET approximation`](https://docs-demo.elastic.dev/docs/reference/query-languages/esql/directives/set) directive enables approximation from within a query. It takes precedence over the [Fast mode](#esql-kibana-fast-mode-toggle) toggle, so you can force approximate or exact results for a specific query.
To approximate a `STATS` query with default settings, prepend `SET approximation=true;` to your query:
```esql
SET approximation=true;
FROM kibana_sample_data_logs
| WHERE @timestamp >= NOW()-30d
| STATS total_hits = COUNT(),
avg_bytes = AVG(bytes)
BY geo.dest
| SORT total_hits DESC
| LIMIT 5
```
Elastic Cloud Serverless: Preview Elastic Stack: Preview since 9.5 To get exact results while **Fast mode** is on, prepend `SET approximation=false;` to your query.
To tune the sample size or turn off confidence intervals, pass a map. For example:
- `SET approximation={"rows":5000000};` increases the sample size from the default.
- `SET approximation={"confidence_level":null};` skips confidence interval computation for additional speedup.
The editor suggests these map parameters as you type.
For supported aggregation functions, output columns, tuning options, and limitations, refer to [Approximate `STATS` queries](https://docs-demo.elastic.dev/docs/reference/query-languages/esql/esql-query-approximation).
### Interpret approximate results
An approximate query returns your usual `STATS` columns, plus two extra columns for each approximated value, where `` is the name of the approximated column (for example, `_approximation_confidence_interval(count)`):
- `_approximation_confidence_interval()`: The range that the exact value is very likely to fall within (with a 90% confidence level). For example, an estimated count of `769` shown with `[759, 779]` means the exact count is very likely between 759 and 779. A narrower range means a more precise estimate. It's empty when no range can be computed, and zero-width (such as `[769, 769]`) when the result is actually exact.
- `_approximation_certified()`: Whether the estimate passed the statistical checks behind the confidence interval. `true` means the interval is reliable. `false` means the estimate might still be accurate, but the interval couldn't be fully validated.
Elastic Cloud Serverless: Preview Elastic Stack: Preview since 9.5 In [**Discover**](/docs/explore-analyze/discover/esql-results#esql-kibana-results-table), these appear as additional columns in the results table.
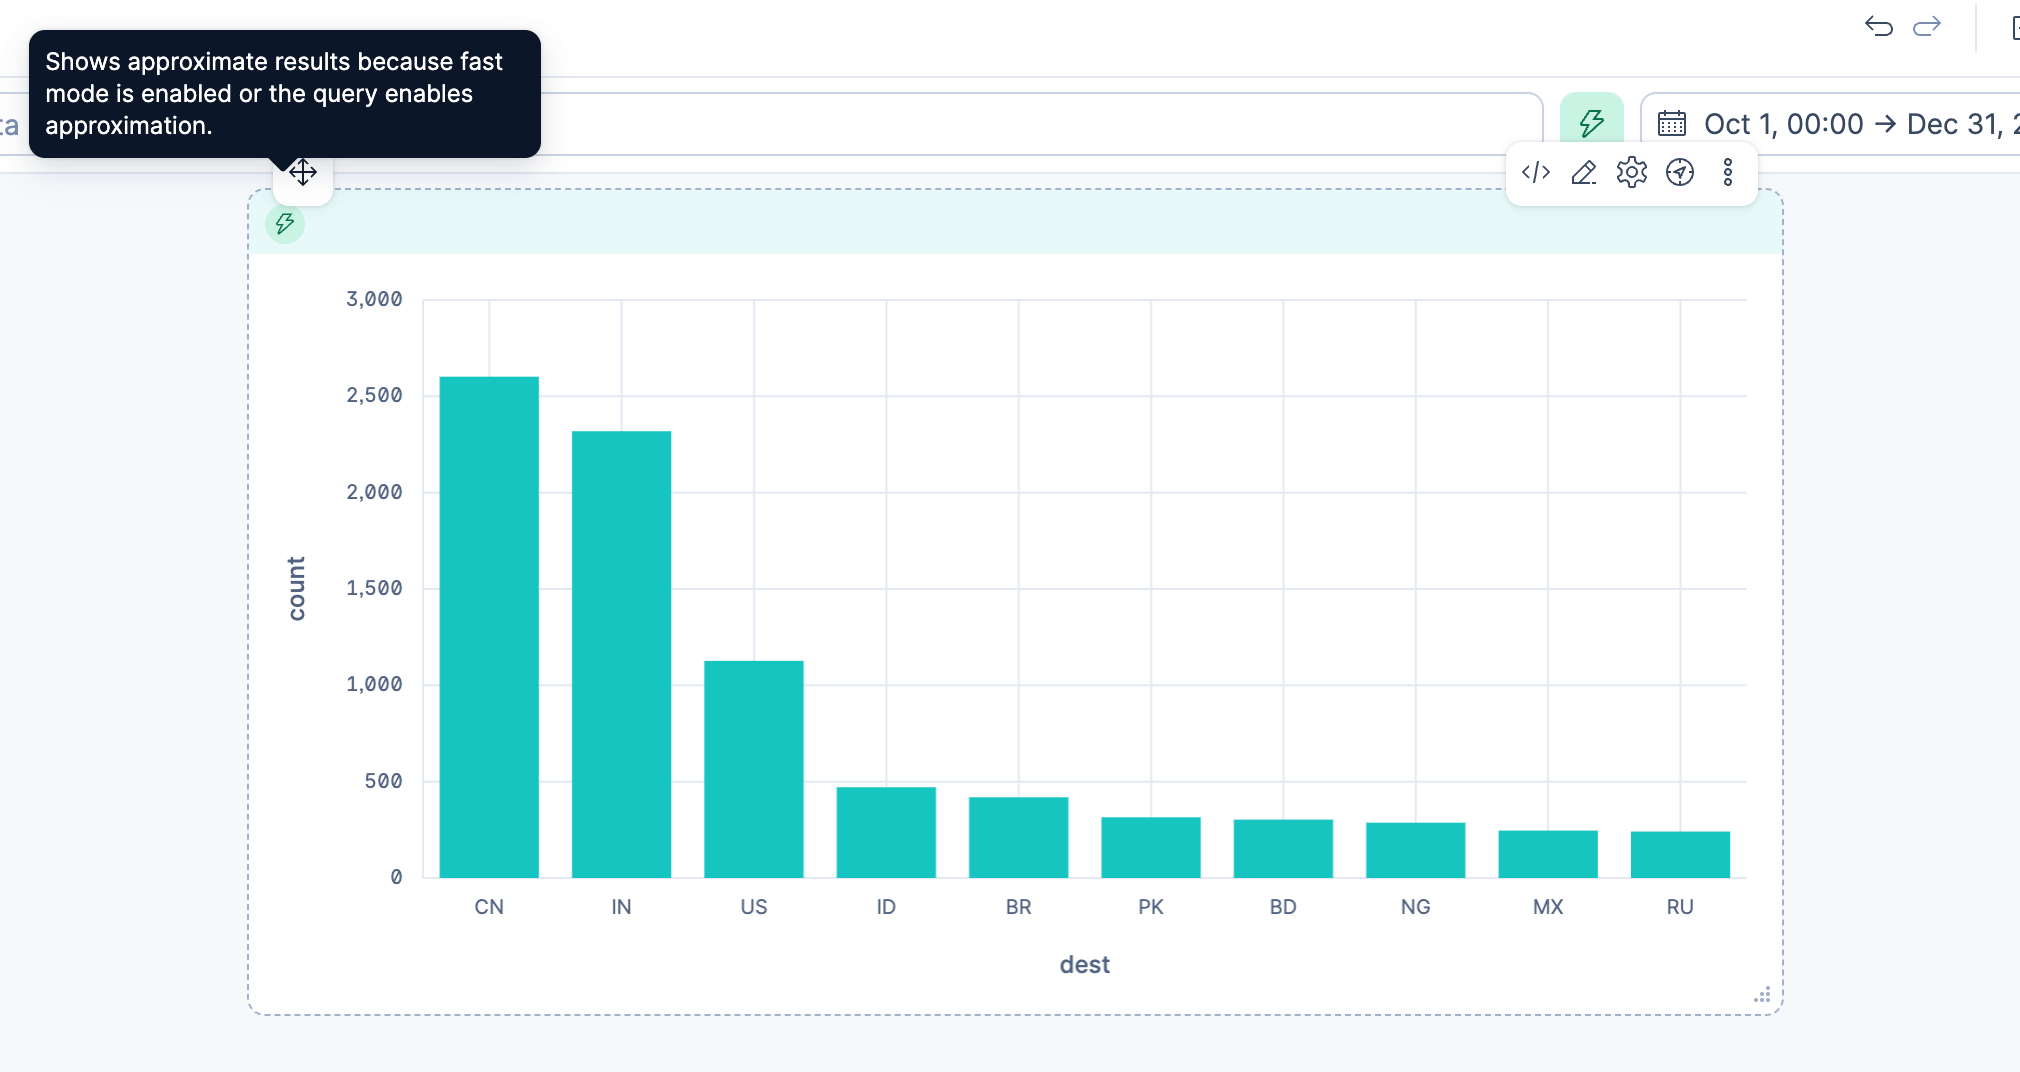
Elastic Cloud Serverless: Preview Elastic Stack: Planned A `bolt` badge shows when Elasticsearch applied approximation, so you can tell estimates from exact results. In Discover, the badge appears next to the chart actions and in the table toolbar. On a dashboard, it appears in the header of each panel that ran an approximate query. Hover over the badge to see why the results are approximate. If Elasticsearch still [returns exact results](#approximation-fast-mode), such as when the time range matches few documents, no badge appears.
For more details, refer to [Approximate `STATS` queries](https://docs-demo.elastic.dev/docs/reference/query-languages/esql/esql-query-approximation).
## Related pages
- [ES|QL reference](https://docs-demo.elastic.dev/docs/reference/query-languages/esql/esql-syntax-reference): Complete list of commands, functions, and operators.
- [Get started with ES|QL in Discover](https://www.elastic.co/docs/explore-analyze/discover/try-esql): Hands-on tutorial for your first ES|QL queries in Discover.
- [How to query in Discover's ES|QL mode](https://www.elastic.co/docs/explore-analyze/discover/use-esql): Write and refine ES|QL queries in Discover.
- [ES|QL for Elastic Security](https://www.elastic.co/docs/solutions/security/esql-for-security): Use cases and examples for threat hunting and detection rules.
- [ES|QL visualizations](https://www.elastic.co/docs/explore-analyze/visualize/esorql): Create and edit ES|QL-based visualizations in dashboards.
- [Add variable controls to dashboards](https://www.elastic.co/docs/explore-analyze/visualize/add-variable-controls): Add ES|QL-powered variable controls to dashboards.
- Elastic Cloud Serverless: Generally available Elastic Stack: Generally available since 9.4 [Custom Vega visualizations](/docs/explore-analyze/visualize/custom-visualizations-with-vega#vega-esql-queries): Use ES|QL queries as a data source in Vega and Vega-Lite visualizations.
- [Optimize ES|QL query performance](https://docs-demo.elastic.dev/docs/reference/query-languages/esql/esql-query-performance): Techniques for writing fast queries and identifying slow ones.