---
title: Inspect grouped STATS results in Discover
description: See the documents behind each STATS group in Discover, including CATEGORIZE patterns, sparklines, and row actions.
url: https://www.elastic.co/docs/explore-analyze/discover/inspect-grouped-stats
products:
- Elastic Documentation
- Kibana
applies_to:
- Elastic Cloud Serverless: Preview
- Elastic Stack: Preview since 9.4
---
# Inspect grouped STATS results in Discover
If you group results with [`STATS BY`](https://docs-demo.elastic.dev/docs/reference/query-languages/esql/commands/stats-by), you can look inside each group to see the documents behind a count or an average. When a query groups by one field, **Discover** shows each group as a row that you can expand, instead of a flat table with one row per group. Each row stands for one unique value of the grouping field, which is the field after `BY`.
## Before you begin
- Make sure **Discover** is in ES|QL mode. Classic mode doesn't support this functionality. To switch, refer to [Switch to Discover's ES|QL mode](/docs/explore-analyze/discover/switch-esql-mode#switch-discover-query-mode).
- If you're new to ES|QL in Discover, start with [Get started with ES|QL in Discover](https://www.elastic.co/docs/explore-analyze/discover/try-esql).
- To get expandable groups, your query needs to group by a single field, or by a single [`CATEGORIZE`](https://docs-demo.elastic.dev/docs/reference/query-languages/esql/functions-operators/grouping-functions/categorize) call on a field. If your query has more than one `STATS` command, **Discover** uses the last one. The `CATEGORIZE` function requires a [Platinum or Enterprise subscription](https://www.elastic.co/subscriptions) or an active trial.
- These queries keep the standard flat results table:
- Queries that group by more than one field, for example `BY clientip, extension.keyword`.
- Queries that use other grouping functions, such as `BUCKET` or `TBUCKET`, or that nest a function inside `CATEGORIZE`.
- Queries where a later `KEEP` command drops the grouping field.
- Queries whose data source is a subquery.
- Elastic Cloud Serverless: Preview Elastic Stack: Preview since 9.5 Queries that use [`TS_INFO`](https://docs-demo.elastic.dev/docs/reference/query-languages/esql/commands/ts-info) or [`METRICS_INFO`](https://docs-demo.elastic.dev/docs/reference/query-languages/esql/commands/metrics-info). Their rows describe metrics and have no documents to expand.
## View grouped results from a STATS query
1. In **Discover**, in ES|QL mode, enter a `STATS BY` query with a single grouping field. For example:
```esql
FROM kibana_sample_data_logs
| STATS Visits = COUNT(*), AvgBytes = AVG(bytes) BY geo.dest
| SORT Visits DESC
```
2. Select **Search**.
**Result:** The table lists one row per group. The results count reports the number of groups instead of the number of documents.
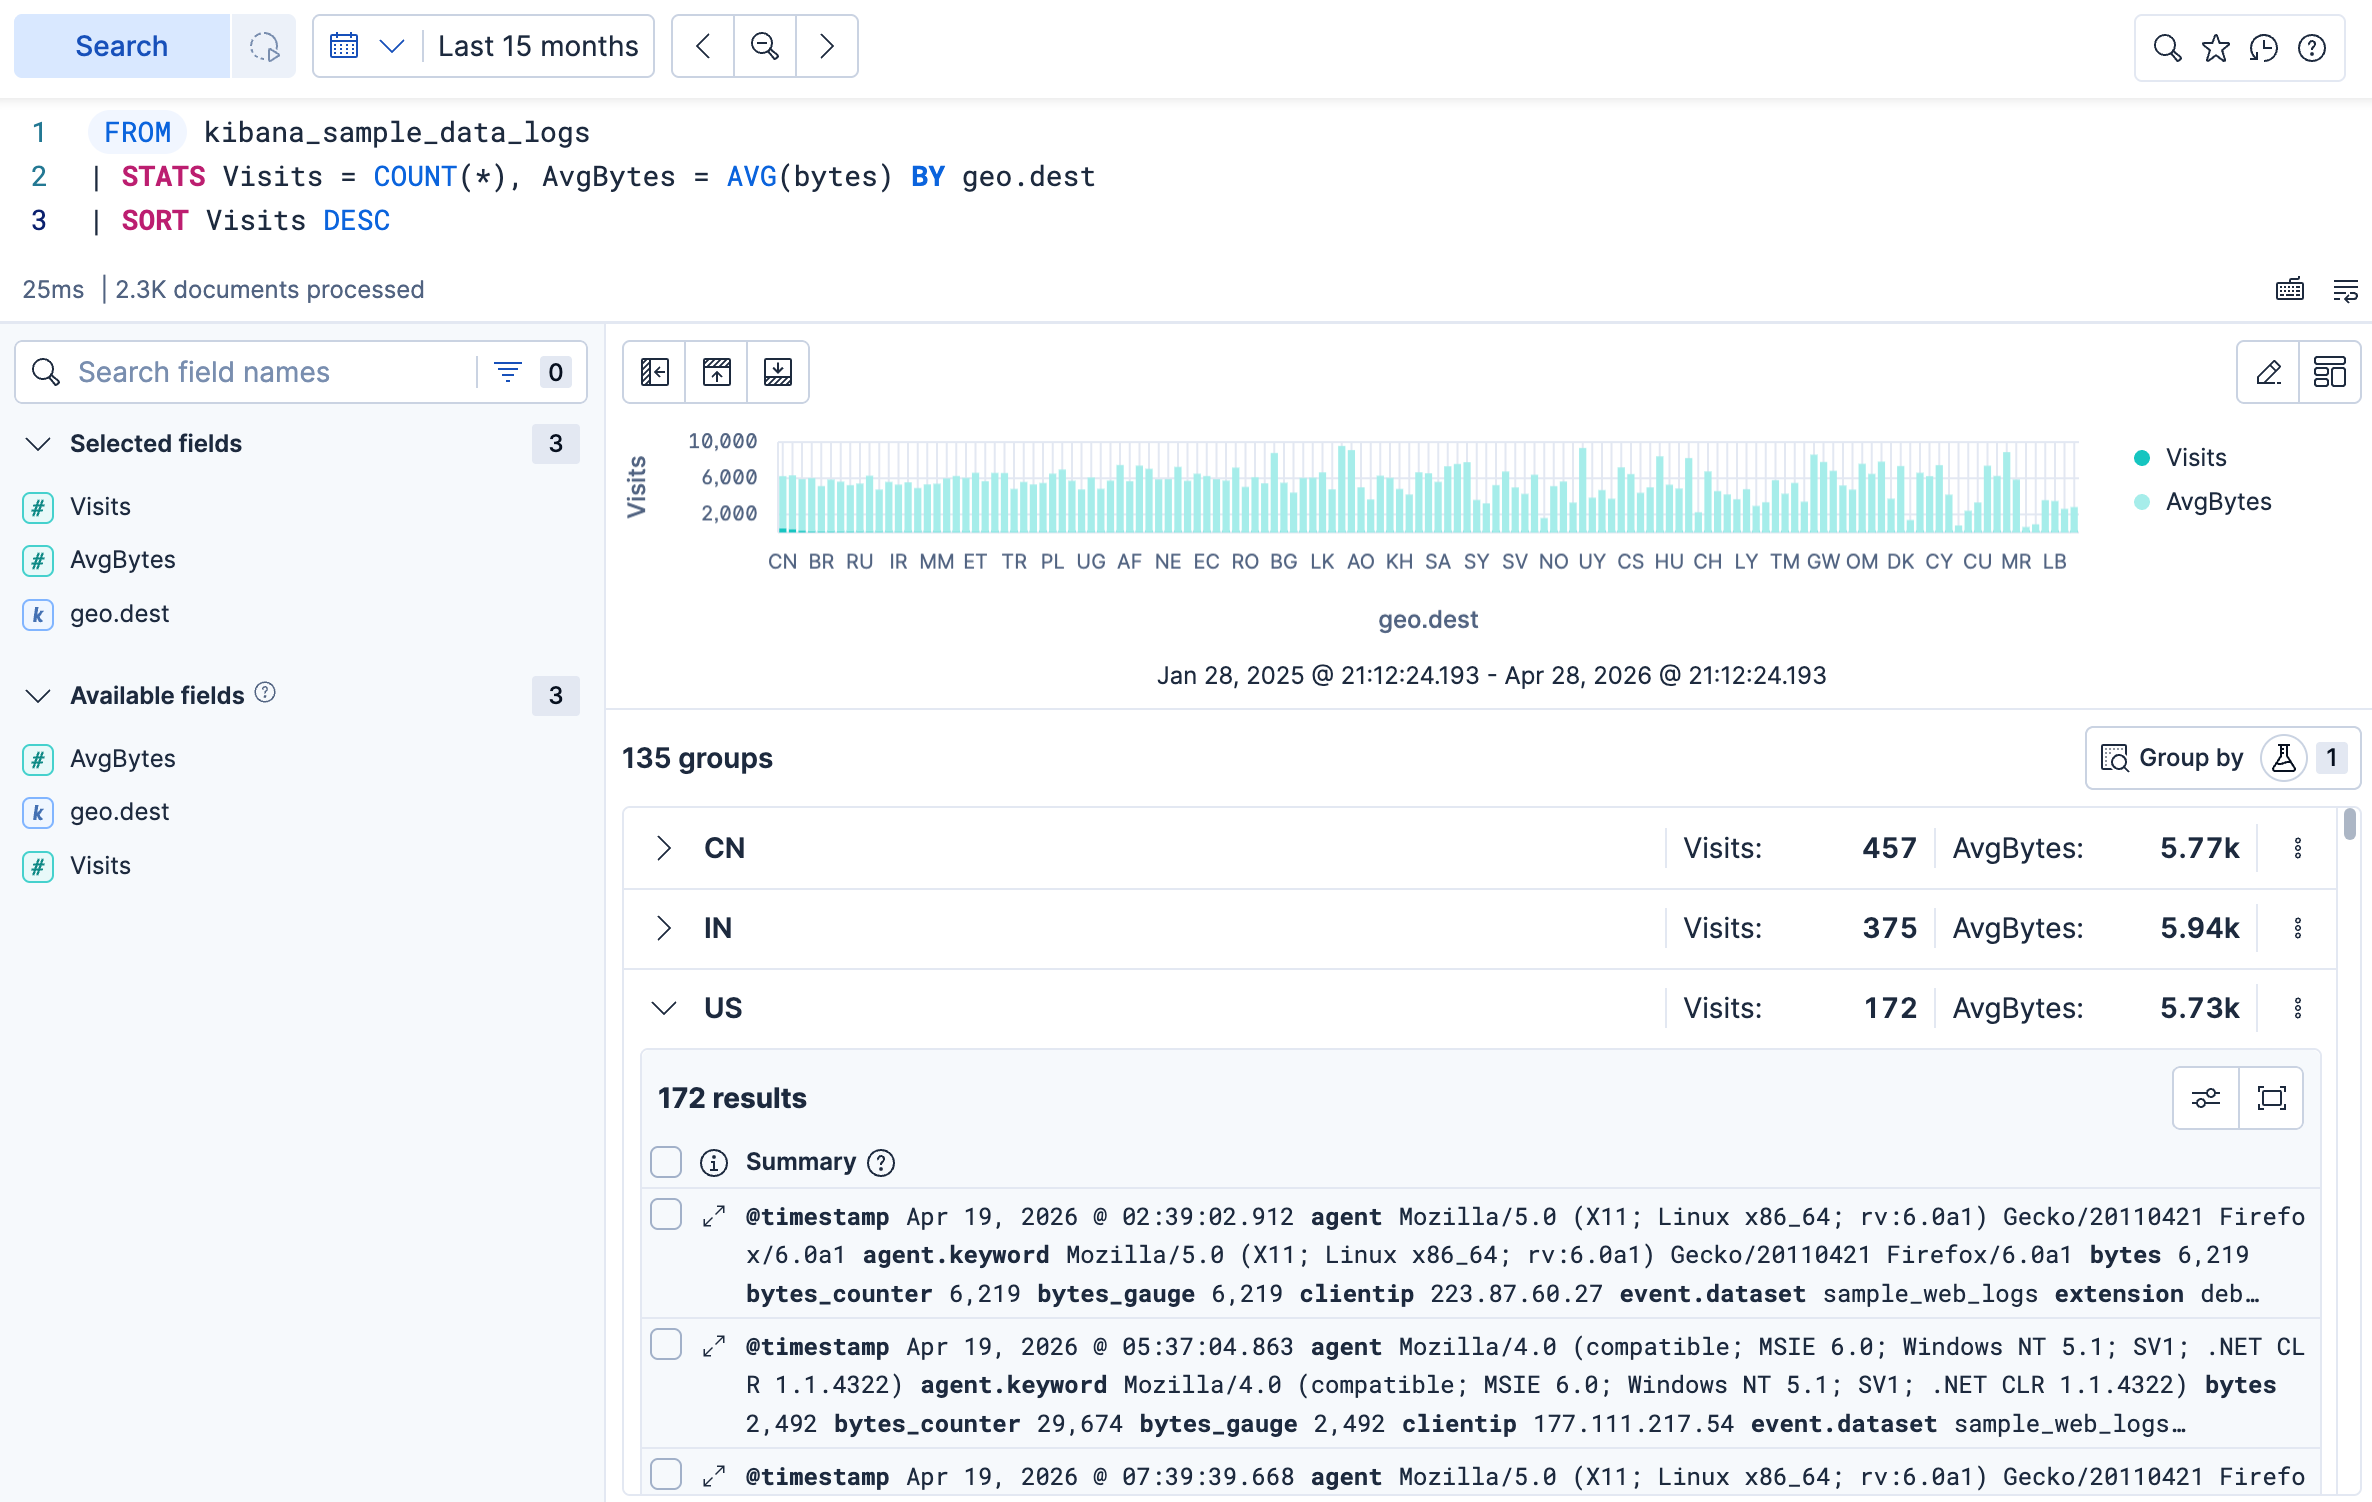
3. Expand a row to inspect the underlying documents.
On large data sets, you can get faster, estimated results by turning on `bolt` **Fast mode**. Refer to [Use ES|QL in Kibana > Get faster results with approximate STATS](/docs/explore-analyze/query-filter/languages/esql-kibana#approximation-fast-mode).
## Show CATEGORIZE patterns in the group titles
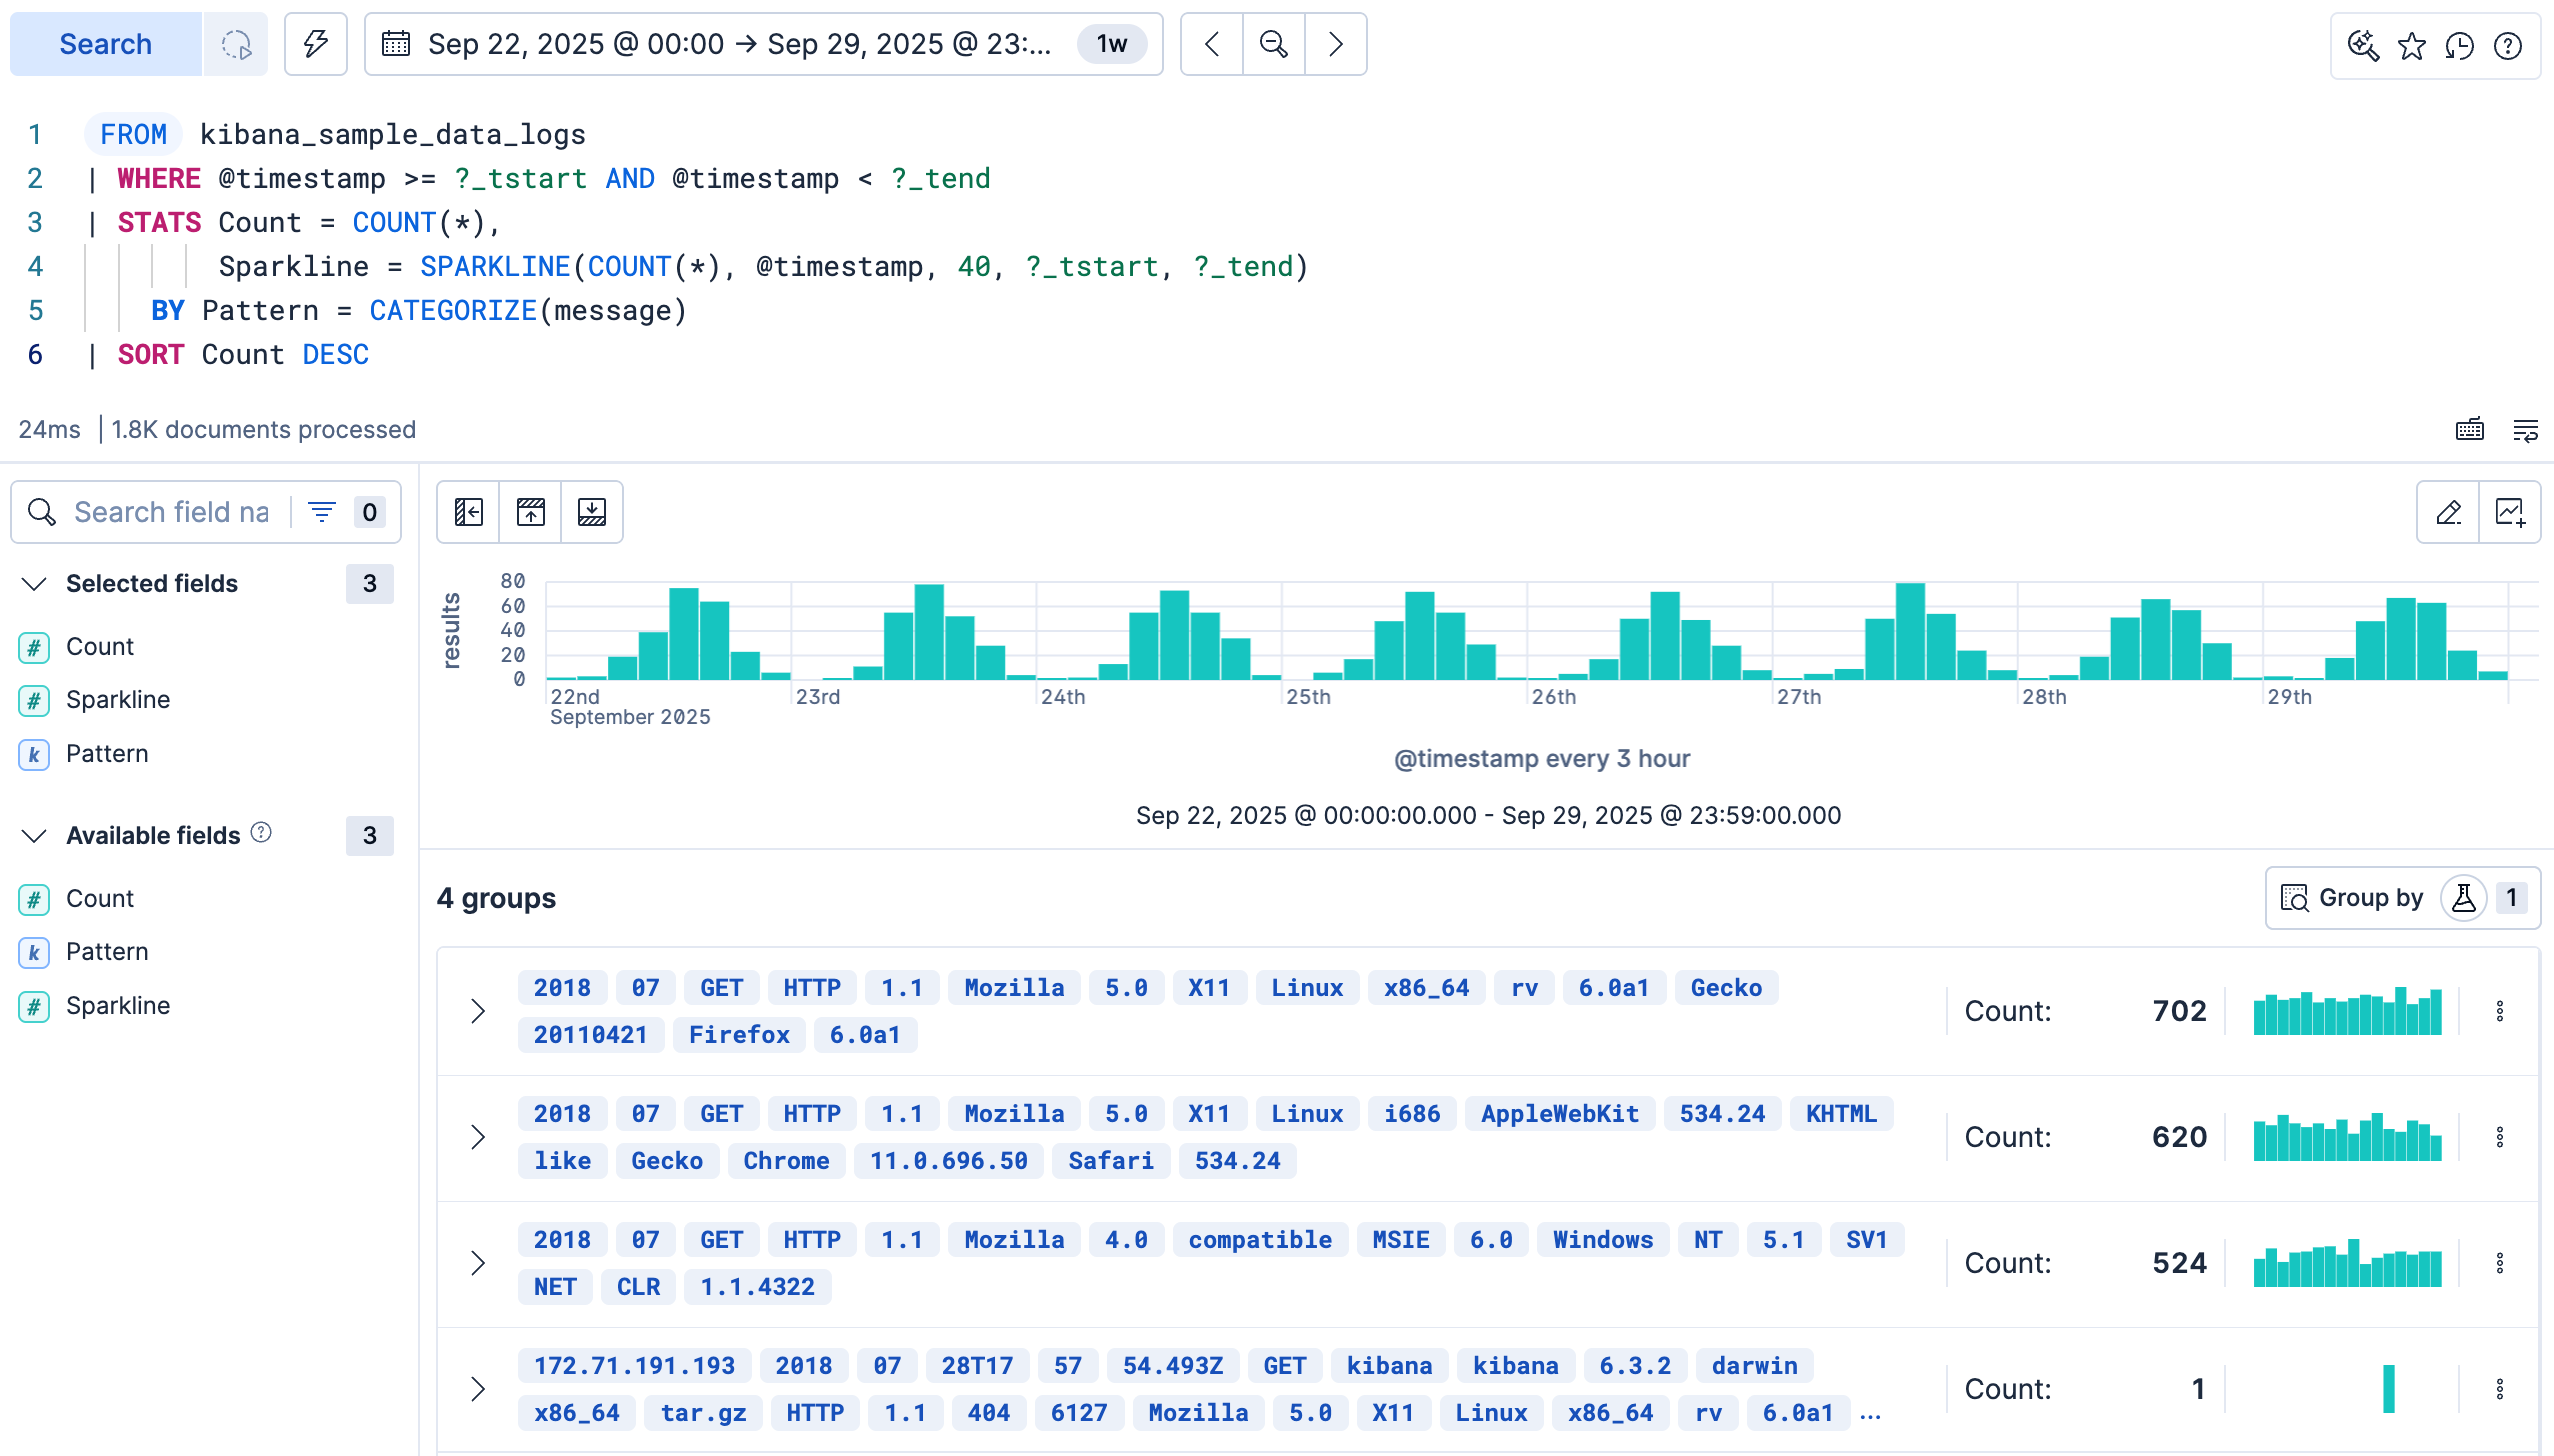
When the grouping field uses [`CATEGORIZE`](https://docs-demo.elastic.dev/docs/reference/query-languages/esql/functions-operators/grouping-functions/categorize), each row title shows a detected pattern, which is a group of similar messages, with the changing words highlighted. This helps you scan repeated message structures at a glance.
```esql
FROM kibana_sample_data_logs
| STATS Count = COUNT(*) BY Pattern = CATEGORIZE(message)
| SORT Count DESC
```
To run a pattern analysis without writing a query, refer to [Run a pattern analysis on your log data in Discover](https://www.elastic.co/docs/explore-analyze/discover/run-pattern-analysis-discover).
## Add sparklines to patterns
- Elastic Cloud Serverless: Preview
- Elastic Stack: Preview since 9.5
When the query also computes a [`SPARKLINE`](https://docs-demo.elastic.dev/docs/reference/query-languages/esql/functions-operators/aggregation-functions/sparkline) over time, **Discover** renders a sparkline, which is a small trend chart, next to the row aggregates. For example, the following query categorizes log messages and renders a sparkline for each pattern:
```esql
FROM kibana_sample_data_logs
| WHERE @timestamp >= ?_tstart AND @timestamp < ?_tend
| STATS Count = COUNT(*),
Sparkline = SPARKLINE(COUNT(*), @timestamp, 40, ?_tstart, ?_tend)
BY Pattern = CATEGORIZE(message)
| SORT Count DESC
```
On larger data sets, add a [`SAMPLE`](https://docs-demo.elastic.dev/docs/reference/query-languages/esql/commands/sample) command before `STATS` to keep the categorization fast. Because `SAMPLE 0.001` keeps about one document in a thousand, divide `COUNT(*)` by the same fraction, `Count = COUNT(*) / 0.001`, so the counts stay representative.
## Act on a grouped row
Select the `boxes_vertical` actions button on any group row to:
- **Copy to clipboard**: Copy the group's value.
- **Filter in**: Add a `WHERE` clause before the `STATS` command that keeps only documents matching this group.
- **Filter out**: Add a `WHERE` clause before the `STATS` command that excludes documents matching this group.
- **Open in new tab**: Open the documents in this group in a new Discover tab, with a query scoped to that group.
If the grouping field isn't filterable, **Filter in** and **Filter out** are unavailable.
## Opt out of grouped results
If you prefer the flat results table, you can switch grouped results off. When grouped results are active, Discover replaces the regular results table toolbar with a **Group by** button that carries a `flask` badge and shows the number of active groupings. Discover preselects the grouping field from your `STATS BY` clause. To go back to the flat results table and the regular toolbar, open the **Group by** menu and select **none**. The **Group by** button stays in the toolbar of the flat table. To bring the grouping back, open the menu again and select the grouping field.
## Related pages
- [How to query in Discover's ES|QL mode](https://www.elastic.co/docs/explore-analyze/discover/use-esql)
- [Run a pattern analysis on your log data](https://www.elastic.co/docs/explore-analyze/discover/run-pattern-analysis-discover)
- [`STATS` command reference](https://docs-demo.elastic.dev/docs/reference/query-languages/esql/commands/stats-by)
- [Get faster results with approximate `STATS`](/docs/explore-analyze/query-filter/languages/esql-kibana#approximation-fast-mode)