---
title: How Discover works
description: See what Discover shows by default, how you define the data to explore, and how query modes, context-aware experiences, and sharing fit in.
url: https://www.elastic.co/docs/explore-analyze/discover/discover-get-started
products:
- Elastic Documentation
- Kibana
applies_to:
- Elastic Cloud Serverless: Generally available
- Elastic Stack: Generally available
---
# How Discover works
When you need to look at the documents in your data, find out why something happened, or check that data arrived as expected, **Discover** is where you start. You query your data, and **Discover** shows the results as a table and, when the data allows it, as a chart.
If you're new to **Discover**, the rest of this page shows what's on screen, how you select your data, and how to keep what you find. To try it hands-on, follow [Get started with ES|QL in Discover](https://www.elastic.co/docs/explore-analyze/discover/try-esql).
To open **Discover**, find it in the navigation menu or use the [global search field](https://www.elastic.co/docs/explore-analyze/find-and-organize/find-apps-and-objects). You can also arrive in **Discover** with a query already set, from a [dashboard panel](/docs/explore-analyze/dashboards/using#explore-panel-data-in-discover) or from a [link that someone shared](/docs/explore-analyze/discover/copy-and-share-documents#share-your-findings).
## What you see in Discover
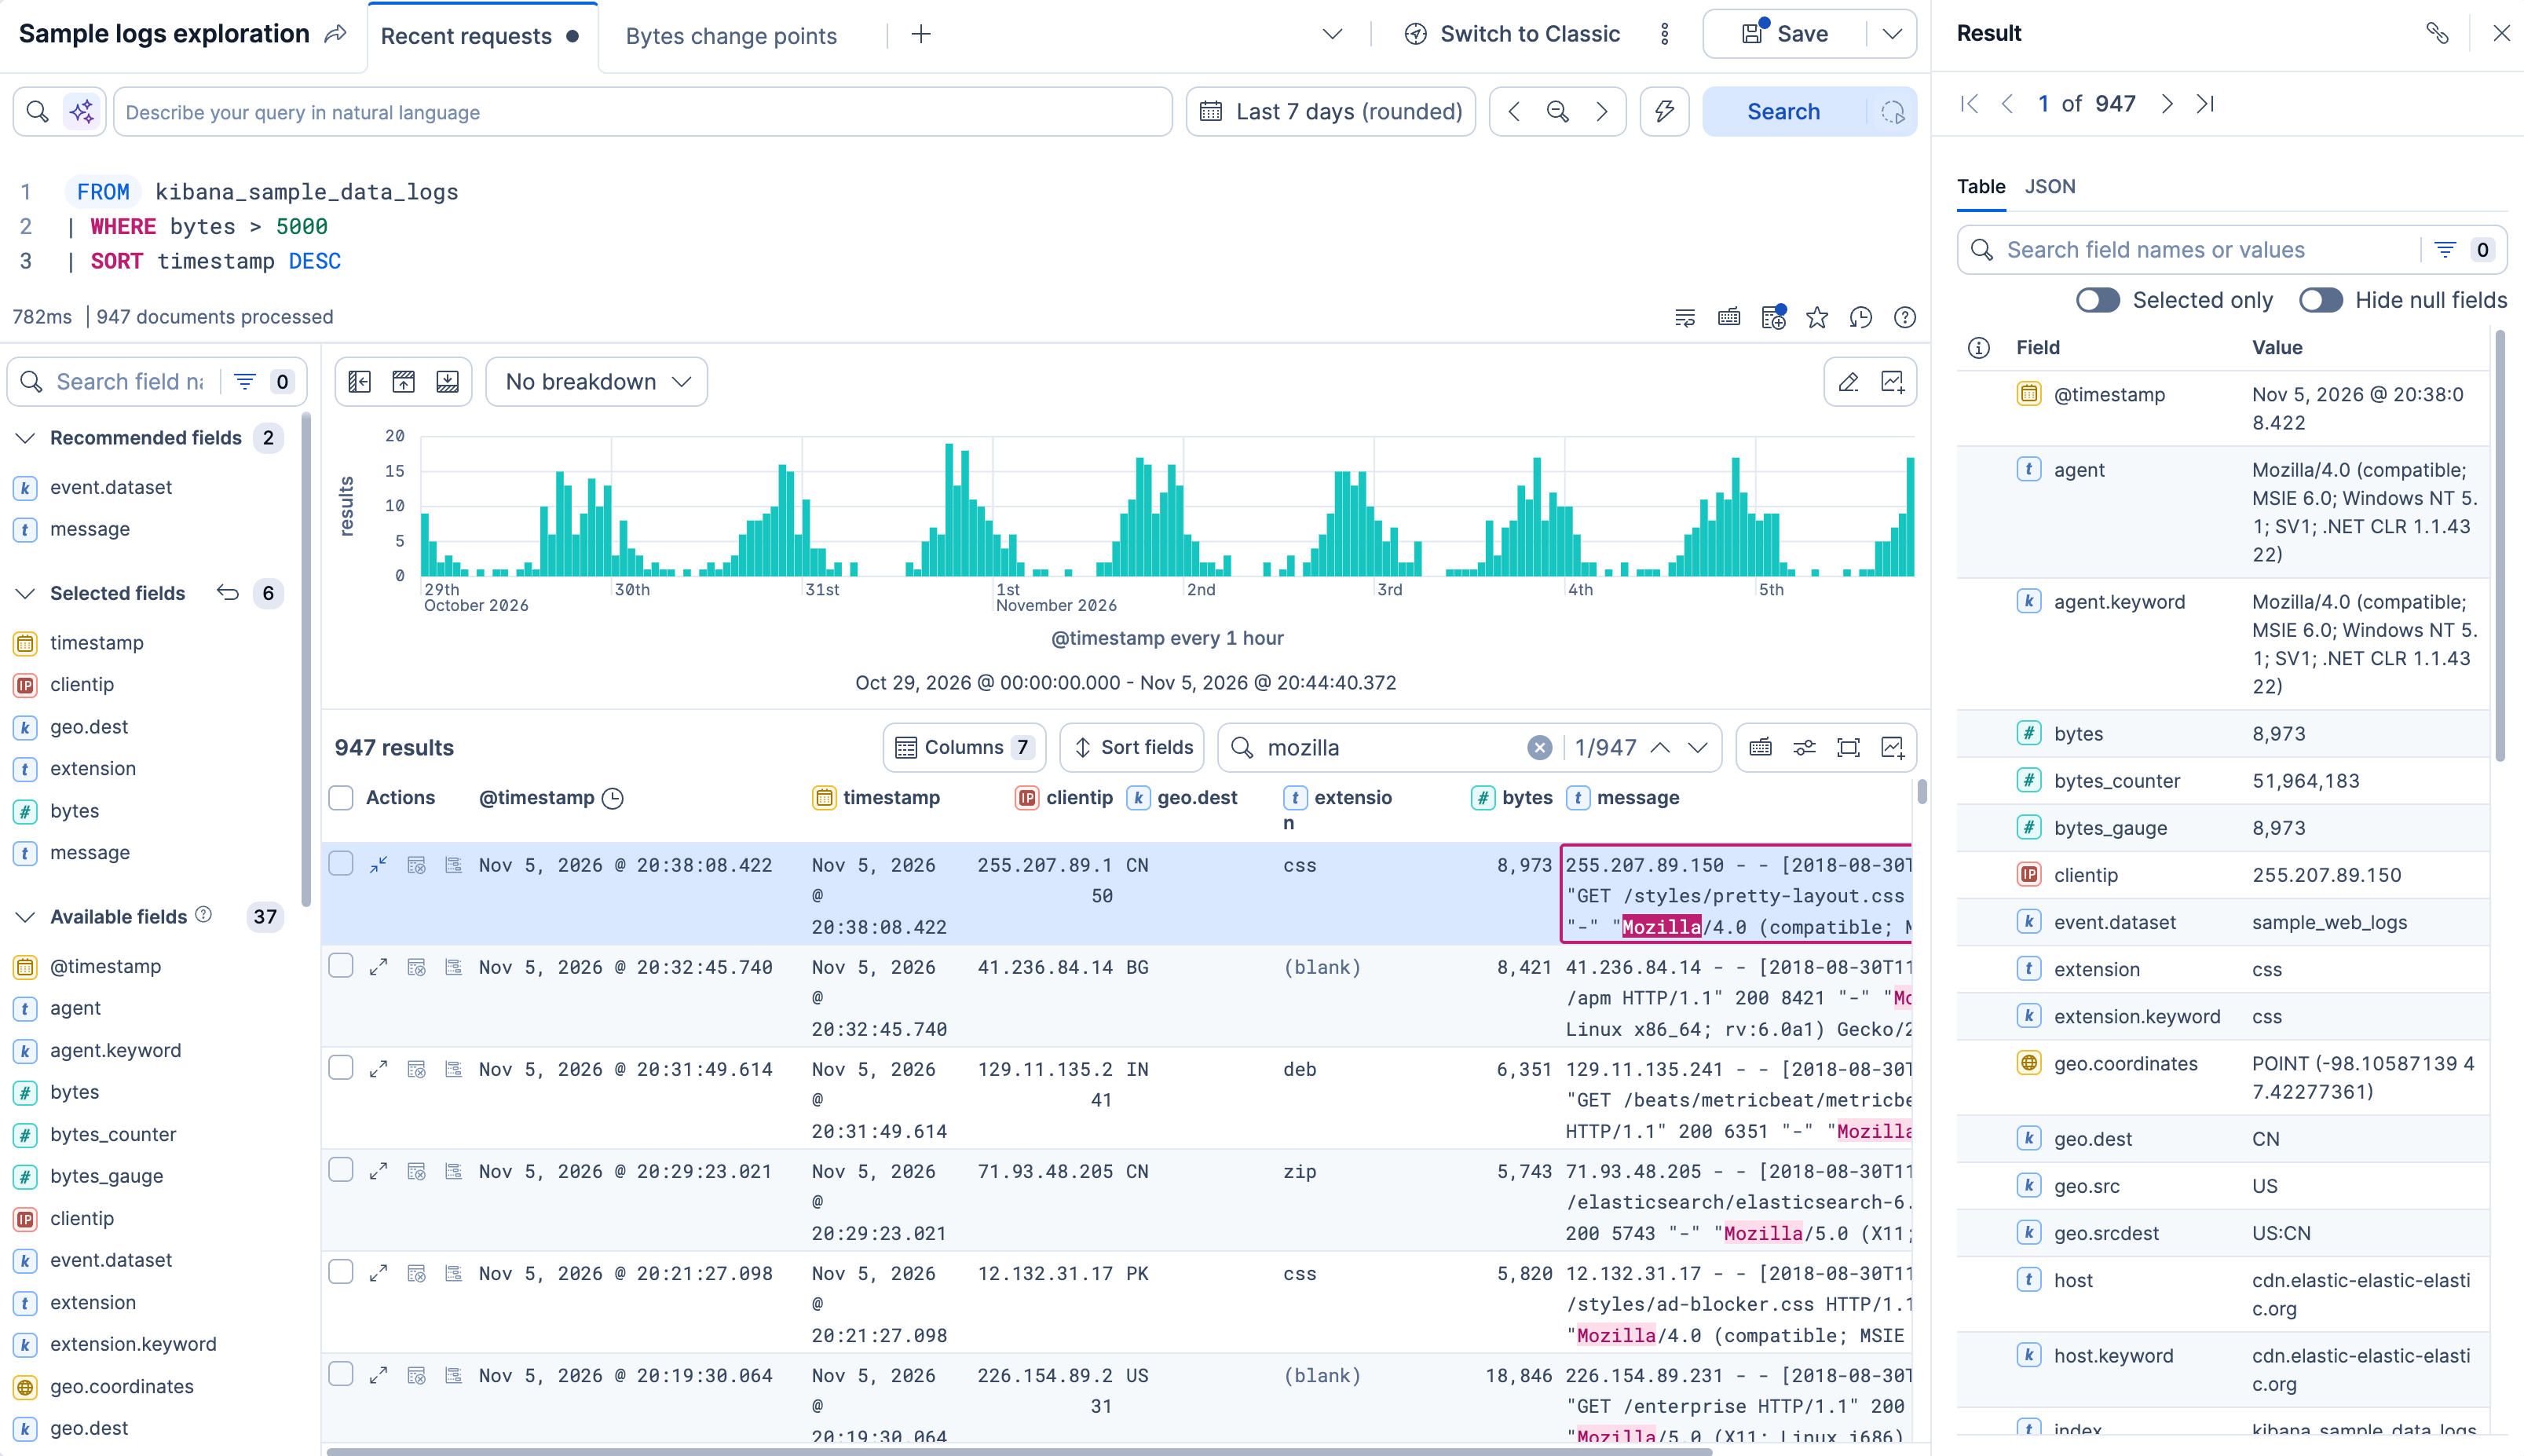
In **Discover**, the data, a query, and a time range make up a session. You can save a session and reopen it later. The time range is stored only if you turn on **Store time with Discover session** when you save. The screen shows the following parts. You can [customize them](https://www.elastic.co/docs/explore-analyze/discover/document-explorer) to fit your work, and some change automatically for certain kinds of data. Refer to [Context-aware experiences](#context-aware-discover).
Elastic Cloud Serverless: Preview Elastic Stack: Preview since 9.2 A single session can have several tabs, each with its own exploration, such as a different query and time range. Refer to [Run multiple explorations with tabs](https://www.elastic.co/docs/explore-analyze/discover/work-with-tabs).
The top of **Discover** is where you define the data to explore and set the time range. In ES|QL mode, you write your query in the editor. In classic mode, you select a data view, then search it with the search bar. Refer to the [two query modes](#query-modes).
Shows the fields of your data. Select a field to see its details. In classic mode, they include the field's most frequent values.
Shows how the results spread over the time range, when your data has a time field. Some queries, such as ones that summarize your results, change what the chart shows.
Shows the results, one row for each document. In ES|QL mode, a row is a result row, so a query that summarizes your data returns one row for each summary.
When you need to focus on one result, select `maximize` **View details** on its row. A panel opens beside the table and shows the fields of that document. In ES|QL mode, it shows the columns that your query returned. Refer to [Look inside a document](/docs/explore-analyze/discover/inspect-documents#look-inside-a-document).
## Query modes in Discover
**Discover** has two ways to define the data you explore, called query modes. You can [switch between them](https://www.elastic.co/docs/explore-analyze/discover/switch-esql-mode) at any time.
- [ES|QL mode](https://www.elastic.co/docs/explore-analyze/discover/use-esql): You write a query in [ES|QL](https://docs-demo.elastic.dev/docs/reference/query-languages/esql), the Elasticsearch query language. The query names the data to explore and can also filter it, calculate new fields, and summarize it. For example, `FROM kibana_sample_data_logs | WHERE bytes > 5000` returns the entries in the Kibana sample web logs that transferred more than 5,000 bytes.
- [Classic mode](https://www.elastic.co/docs/explore-analyze/discover/use-classic-mode): You select a [data view](https://www.elastic.co/docs/explore-analyze/find-and-organize/data-views), which is a definition of the data to query, usually saved, such as all your web logs. You then search it with [Kibana Query Language (KQL)](https://www.elastic.co/docs/explore-analyze/query-filter/languages/kql) or [Lucene](https://www.elastic.co/docs/explore-analyze/query-filter/languages/lucene-query-syntax), two search syntaxes, and narrow the results with filters.
Elastic Cloud Serverless: Preview Elastic Stack: Preview since 9.2 Each tab keeps its own query, so one tab can run an ES|QL query while another uses classic mode.
ES|QL mode lets you query your data sources directly, with optimized support for time series data through the [`TS`](https://docs-demo.elastic.dev/docs/reference/query-languages/esql/commands/ts) and [`PROMQL`](https://docs-demo.elastic.dev/docs/reference/query-languages/esql/commands/promql) commands. You can also transform the data right from the query, for example with the [`EVAL`](https://docs-demo.elastic.dev/docs/reference/query-languages/esql/commands/eval) or [`STATS`](https://docs-demo.elastic.dev/docs/reference/query-languages/esql/commands/stats-by) commands. You don't need to set up a data view or a runtime field first. To get familiar with it, follow [Get started with ES|QL in Discover](https://www.elastic.co/docs/explore-analyze/discover/try-esql).
## Context-aware experiences
**Discover** adapts to the kind of data you explore. When it recognizes your data, it switches to a tailored experience with columns, charts, and document details that suit that data. For example, log data opens with log-specific columns and details, and security alerts get color-coded row indicators. This is called a context-aware experience. When none applies, you get the default **Discover** experience, with all its core functionality for general-purpose data exploration.
Elastic Cloud Serverless: Preview Elastic Stack: Preview since 9.5 The active experience also shapes [AI-powered analysis](https://www.elastic.co/docs/explore-analyze/discover/analyze-discover-data-with-ai): when you query logs, metrics, or traces, the AI agent receives guidance for that type of data. Refer to [How the analysis adapts to your data](/docs/explore-analyze/discover/analyze-discover-data-with-ai#context-aware-deep-analysis).
The experiences you can get depend on where you open **Discover** from, such as a project type or the [solution view](https://www.elastic.co/docs/deploy-manage/manage-spaces) of a space, and then on the data you query:
| | [Logs experience](https://www.elastic.co/docs/solutions/observability/logs/discover-logs) | [Metrics experience](https://www.elastic.co/docs/solutions/observability/infra-and-hosts/discover-metrics) | [Traces experience](https://www.elastic.co/docs/solutions/observability/apm/discover-traces) | [Security alerts and events experience](https://www.elastic.co/docs/solutions/security/investigate/discover-security) |
|-----------------------------------------------------|-------------------------------------------------------------------------------------------|------------------------------------------------------------------------------------------------------------|----------------------------------------------------------------------------------------------|-----------------------------------------------------------------------------------------------------------------------|
| Observability projects and solution views | Yes | Yes [[1]](#note-metrics) | Yes [[2]](#note-traces) | No |
| Security projects and solution views | No | Yes [[1]](#note-metrics) | No | Yes |
| Elasticsearch solution views | No | Yes [[1]](#note-metrics) | No | No |
| Elasticsearch Serverless projects | No | No | No | No |
| Classic solution views [[3]](#classic-setting-note) | Elastic Stack: Planned Yes [[4]](#note-logs-classic) | Yes [[1]](#note-metrics) | Elastic Stack: Planned Yes | Elastic Stack: Planned Yes [[5]](#note-security-classic) |
[1] The metrics experience applies when you query metrics data in ES|QL mode with the `TS` command. The query can also use `LIMIT` and `SORT`, and in Serverless projects and Elastic Stack 9.4 and later, `WHERE`. Any other command turns the experience off. In Serverless projects, it also needs the Observability Complete or Security Complete feature tier. For the Observability tiers, refer to [Elastic Observability Serverless feature tiers](https://www.elastic.co/docs/solutions/observability/observability-serverless-feature-tiers).
[2] In Serverless projects, the traces experience needs the Observability Complete feature tier. For the Observability tiers, refer to [Elastic Observability Serverless feature tiers](https://www.elastic.co/docs/solutions/observability/observability-serverless-feature-tiers).
[3] Elastic Stack: Planned In spaces with the Classic solution view, the logs, traces, and Security experiences apply only while the [**Contextual profiles in Classic navigation**](https://docs-demo.elastic.dev/docs/reference/kibana/advanced-settings#discover-enablesolutionprofilesinclassic) advanced setting is on, which it is by default. The setting name uses "profiles" to mean context-aware experiences.
[4] Elastic Stack: Planned In the Classic solution view, the logs experience applies only to data from some integrations, such as System and Nginx logs. Other log data keeps the default experience. In ES|QL mode, the `FROM` command must name the integration, as in `FROM logs-nginx.access-*`. `FROM logs-*` doesn't match. For the full list, refer to [Explore logs in Discover > Use the logs experience in the Classic solution view](/docs/solutions/observability/logs/discover-logs#logs-classic-solution-view).
[5] Elastic Stack: Planned In the Classic solution view, the Security experience applies when you use a Security data view or when your data view or query targets only Security data. For details, refer to [Explore Security data in Discover > Access the Security Discover experience](/docs/solutions/security/investigate/discover-security#access-the-security-discover-experience).
### When you query several kinds of data
Your query can include several kinds of data that each have a tailored experience. For example, you might query both `logs-*` and `traces-*` indices within an Observability context.
In this case **Discover** provides the default experience until it detects that you're interacting with a single kind of data. For example, when you [look inside a document](/docs/explore-analyze/discover/inspect-documents#look-inside-a-document).
To check which experience is active, open the Inspector and select **Profiles** from the **View** menu. The **Profiles** view lists the solution view and the type of data that Discover detected. Together, they determine the experience. To open the Inspector, refer to [Inspect the request behind your results](/docs/explore-analyze/discover/inspect-documents#inspect-discover-request).
## Save, share, and export what you find
When a session gets you the answer, you have several ways to keep it, share it, or take it somewhere else:
- [Save the session](/docs/explore-analyze/discover/save-open-search#_save_a_discover_session) to reuse its query, filters, and view later.
- [Add the chart, the table, or the whole session to a dashboard](https://www.elastic.co/docs/explore-analyze/discover/use-sessions-in-dashboards) to keep it next to your other panels.
- [Copy a link](/docs/explore-analyze/discover/copy-and-share-documents#share-your-findings) to a session or to a single document, so that others can open the same view.
- [Copy rows](/docs/explore-analyze/discover/copy-and-share-documents#copy-row-content) as text, JSON, or Markdown.
- Export the results of a session as [CSV](/docs/explore-analyze/discover/export-discover-session#export-discover-session-csv) or [JSON](/docs/explore-analyze/discover/export-discover-session#export-discover-session-json).
- [Create an alert rule](https://www.elastic.co/docs/explore-analyze/discover/generate-alerts-from-discover) from your query to keep an eye on it.
## Troubleshooting
If **Discover** asks you to add data or create a data view, refer to [Discover or Dashboards asks you to add data or create a data view](https://www.elastic.co/docs/troubleshoot/kibana/discover-dashboards-no-data-screen). If fields show as empty when they shouldn't, refer to [Some fields show as empty in Discover](https://www.elastic.co/docs/troubleshoot/kibana/discover-empty-fields).
## Next steps
- [Get started with ES|QL in Discover](https://www.elastic.co/docs/explore-analyze/discover/try-esql): Build your first query step by step.
- [What you can do with Discover](/docs/explore-analyze/discover#what-you-can-do): Find what you want to do, from querying and shaping results to saving and sharing them.