---
title: Discover
description: Use Discover to search and filter documents, analyze field structures, visualize patterns, and save findings to reuse later or share with dashboards.
url: https://www.elastic.co/docs/explore-analyze/discover
products:
- Elastic Documentation
- Kibana
applies_to:
- Elastic Cloud Serverless: Generally available
- Elastic Stack: Generally available
---
# Discover
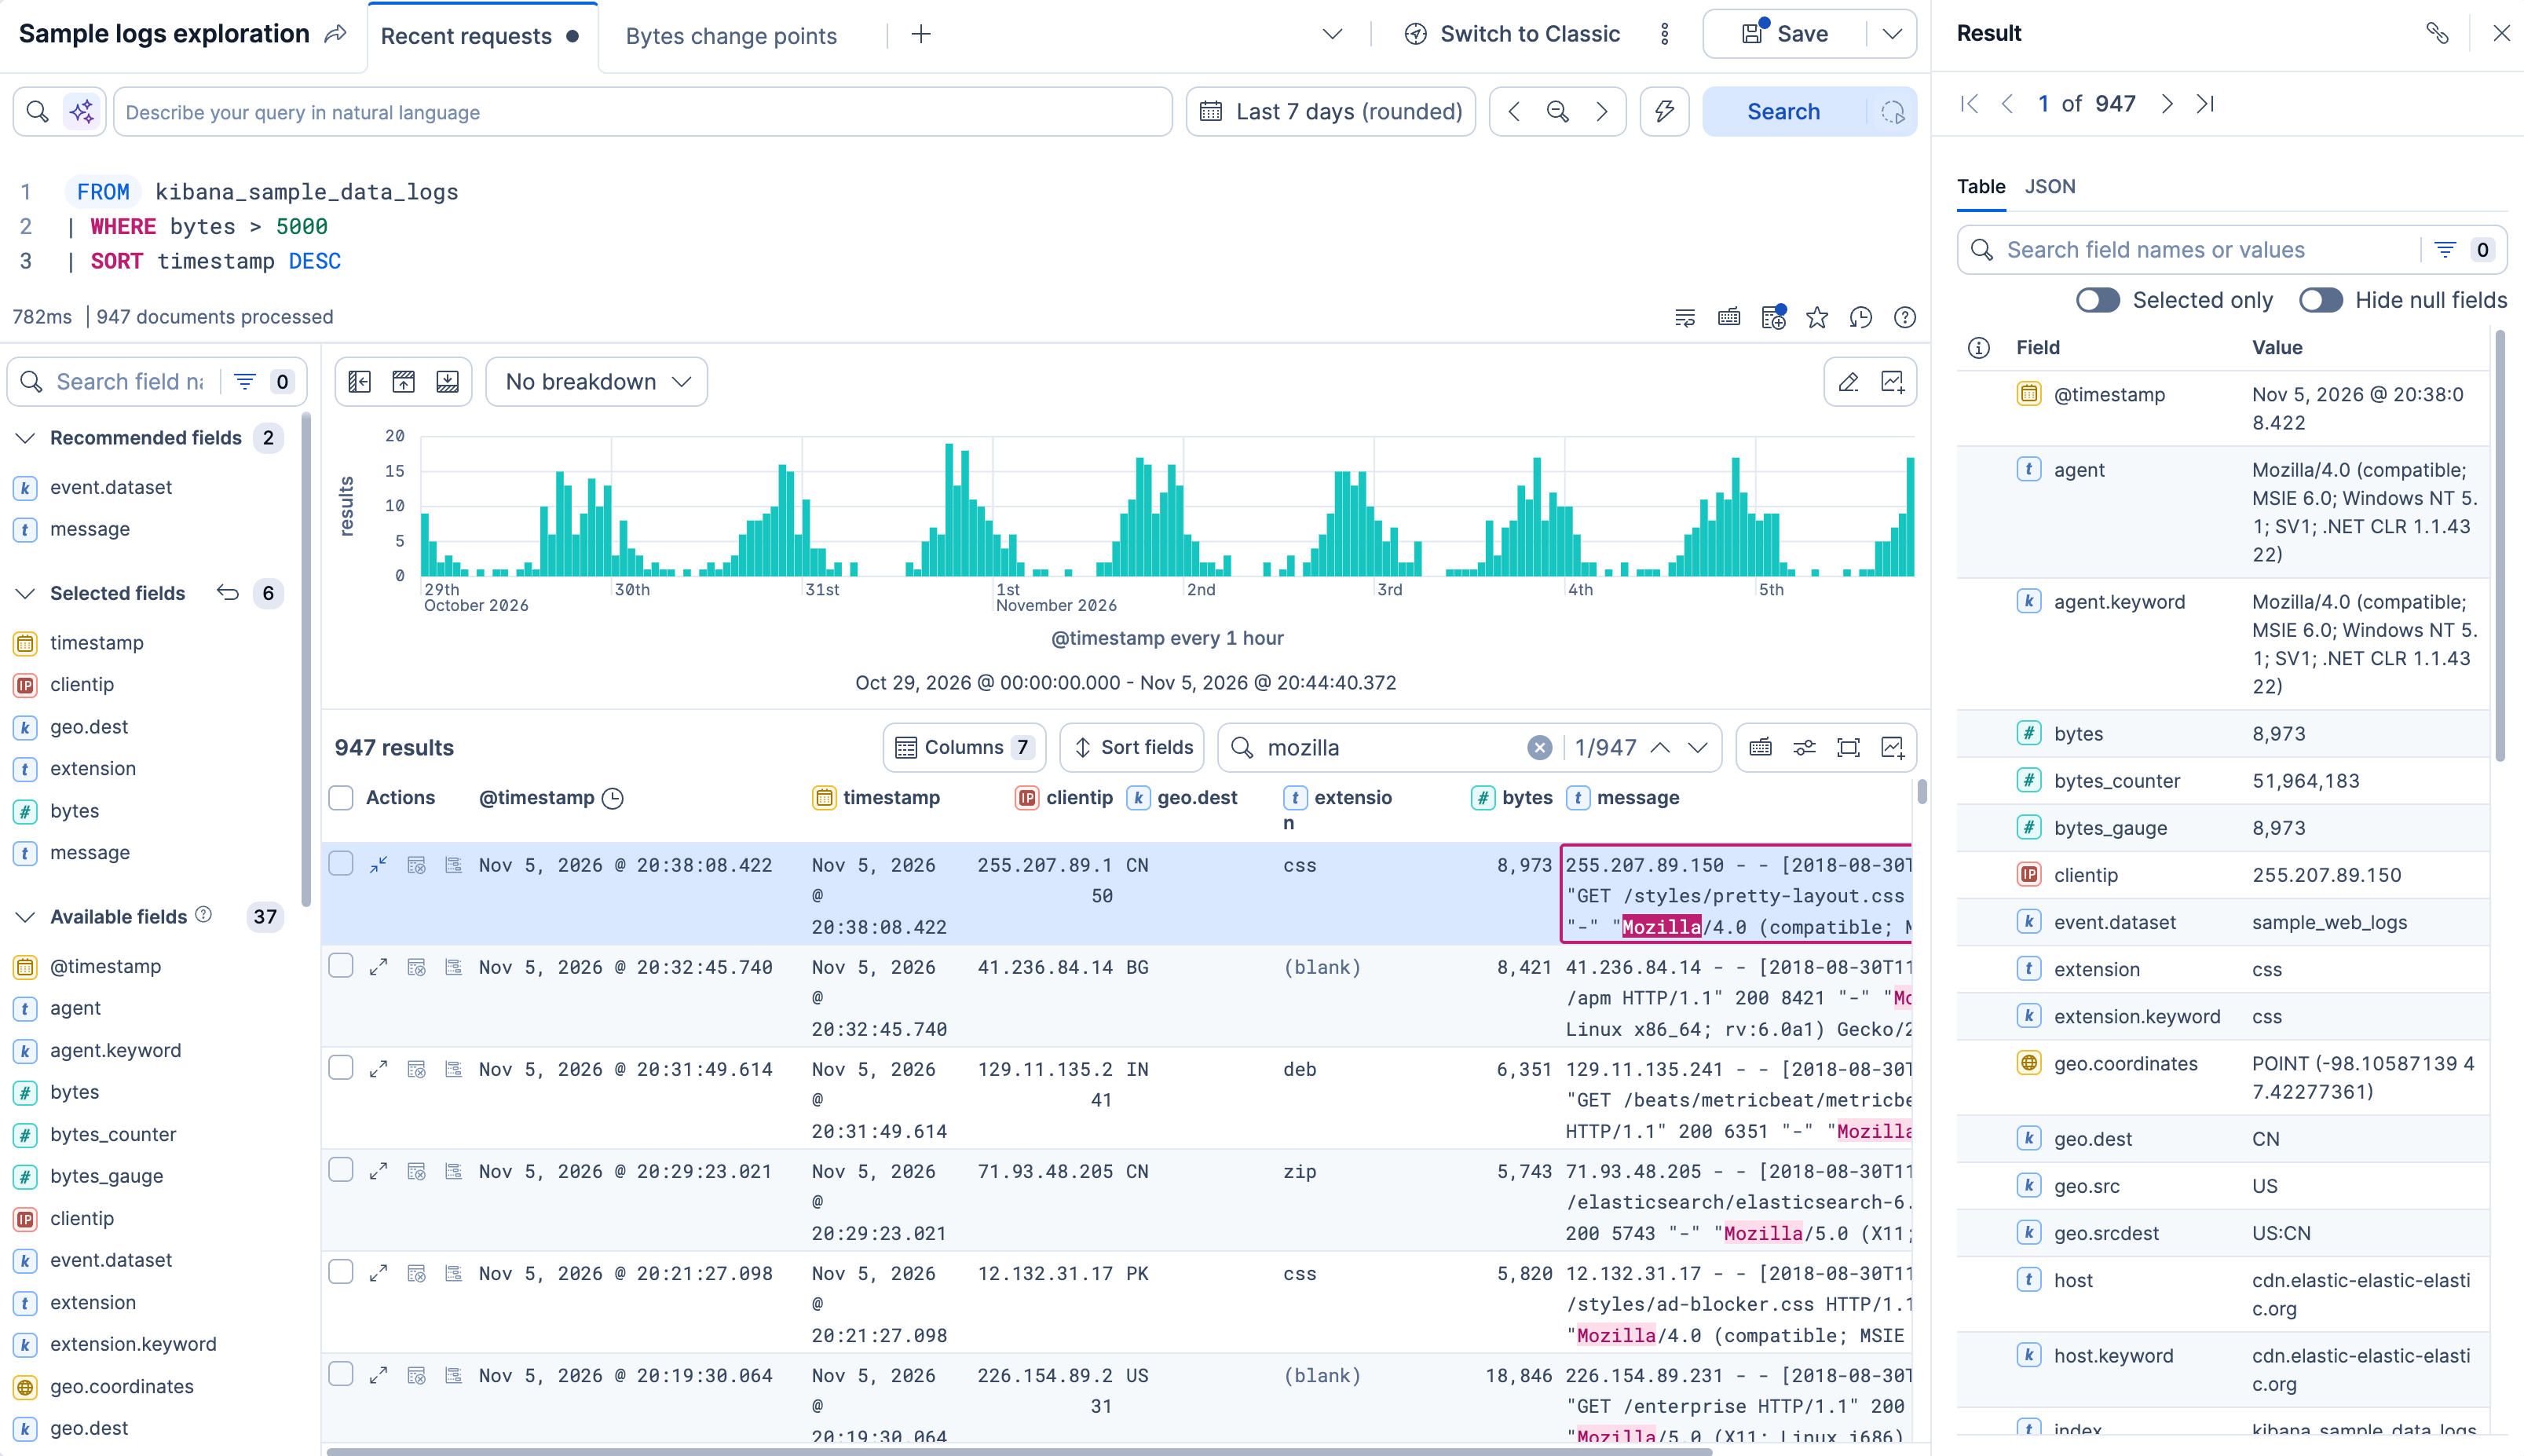
If you need to find out why something happened, spot a trend, or check that your data arrived as expected, use **Discover** to query your Elasticsearch data in Kibana. The results appear as a table and, when the data allows it, a chart. From there, you can look into fields and documents, and save what you find to reuse later or share with dashboards.
## Where to start
- To learn the basics, including the two query modes, tabs, and context-aware experiences, read [How Discover works](https://www.elastic.co/docs/explore-analyze/discover/discover-get-started).
- To learn by running a first query, follow [Get started with ES|QL in Discover](https://www.elastic.co/docs/explore-analyze/discover/try-esql).
- To work from a data view with KQL or Lucene, start with [Search and filter with KQL, Lucene, and filters in Discover's classic mode](https://www.elastic.co/docs/explore-analyze/discover/search-and-filter-classic).
## What you can do with Discover
**Discover** has two query modes: ES|QL mode, where you write an ES|QL query, and classic mode, where you search a data view with KQL or Lucene. Tasks that work in only one mode say which.
**Query your data**
- Query your data in [ES|QL mode](https://www.elastic.co/docs/explore-analyze/discover/use-esql) or in [classic mode](https://www.elastic.co/docs/explore-analyze/discover/use-classic-mode).
- [Open Discover from a dashboard panel](https://www.elastic.co/docs/explore-analyze/dashboards/create-discover-drilldown) with a drilldown.
- Run long queries in the [background](https://www.elastic.co/docs/explore-analyze/discover/background-search).
- Elastic Cloud Serverless: Preview Elastic Stack: Preview since 9.2 Keep [several explorations open side by side](https://www.elastic.co/docs/explore-analyze/discover/work-with-tabs) in tabs.
**Understand your data**
- Explore [individual results and documents](https://www.elastic.co/docs/explore-analyze/discover/inspect-documents).
- See [which fields your data has](https://www.elastic.co/docs/explore-analyze/discover/explore-fields) and what they contain, and break the chart down by a field.
- [Compare documents](https://www.elastic.co/docs/explore-analyze/discover/compare-documents) side by side.
- Find patterns in your log data with [pattern analysis](https://www.elastic.co/docs/explore-analyze/discover/run-pattern-analysis-discover) in classic mode, or with an [ES|QL query that groups by pattern](https://www.elastic.co/docs/explore-analyze/discover/inspect-grouped-stats).
- Check [how the values of each field are distributed](https://www.elastic.co/docs/explore-analyze/discover/show-field-statistics) (classic mode only).
- [Chart a field](https://www.elastic.co/docs/explore-analyze/discover/visualize-field) from the fields list (classic mode only).
- Elastic Cloud Serverless: Generally available Elastic Stack: Generally available since 9.5 [Detect change points](https://www.elastic.co/docs/explore-analyze/discover/detect-change-points) in a time series (ES|QL mode only).
- Elastic Cloud Serverless: Preview Elastic Stack: Preview since 9.5 [Analyze your data with AI](https://www.elastic.co/docs/explore-analyze/discover/analyze-discover-data-with-ai) (ES|QL mode only).
**Shape what your queries return and show**
- [Customize the Discover view](https://www.elastic.co/docs/explore-analyze/discover/document-explorer) to show the columns, density, and layout you need.
- Read, sort, and filter [ES|QL results](https://www.elastic.co/docs/explore-analyze/discover/esql-results) in the table.
- Add [variable controls](https://www.elastic.co/docs/explore-analyze/discover/esql-variable-controls) to make your ES|QL query dynamic without having to duplicate it.
- Add [runtime fields to a data view](https://www.elastic.co/docs/explore-analyze/discover/add-fields-to-data-views) (classic mode only).
- [Sort your results by relevance](https://www.elastic.co/docs/explore-analyze/discover/discover-search-for-relevance).
**Save and share your explorations**
- [Save sessions](/docs/explore-analyze/discover/save-open-search#_save_a_discover_session) to reuse your queries, filters, and views later.
- [Add Discover content to dashboards](https://www.elastic.co/docs/explore-analyze/discover/use-sessions-in-dashboards), as charts, tables, or whole sessions.
- [Export your results](https://www.elastic.co/docs/explore-analyze/discover/export-discover-session) as a CSV file, or the session itself as JSON.
- [Copy results](/docs/explore-analyze/discover/copy-and-share-documents#copy-row-content) as text, JSON, or Markdown, or [share a link](/docs/explore-analyze/discover/copy-and-share-documents#share-your-findings) to a session or a document.
- [Create an alert rule](https://www.elastic.co/docs/explore-analyze/discover/generate-alerts-from-discover) from the query and filters of a session.